
Why Consider Inventory Management Model? One of the leading problems in SCM is the optimization of inventory. Inventory is actually a consequence of other business parameters and policies, such as:
- Company goals and objectives: sales target, fill rate goals, purchase price variance, etc
- Operational policies and parameters: lead times, lot sizes, change over times, safety stocks, replenishment model, frequency and length of planning cycles, etc
- Efficiency in the execution of those policies: forecast accuracy, manufacturing & quality performance at all levels of the supply chain, etc
- Number of discrete levels in the business model: vendors, warehouses, factories, distribution centers, etc
Get Excess and Obsolete Inventory Policy
Calculating inventory level targets and deciding replenishing policies is something that has been studied for a long time and solved through many different inventory management models. Most companies use Information Technology (Enterprise Resource Planning – ERP) to manage the significant amount of data required to plan and manage their Supply Chain.
“My experience is that standard ERPs have not built algorithms to optimize safety stocks, lot sizing and inventory policies, they assume that you know how to calculate those and you just have to enter those values in one of the tabs in the master data file”.
I usually say that ERPs started as transactional tools, they moved to analytical tools and they are in the process to graduate as optimization tools. Companies, in general, are lagging far behind, most of them still trying to figure out how to align transactions from the real-world execution (physical world) with data in their systems (digital world). Of course, some of them can already perform accurate analysis and use meaningful reports. Very few can let their systems optimize variables to drive their operations.
What is the problem with standard transactional systems? The answer is that the inventory targets calculated by those systems are wrong and the consequences are very critical. The main mistakes that I have encountered based on bad or inexistent logic built in the systems are:
- Calculating Safety stocks using period demand or time buckets when Safety stocks must be calculated as a function of the target fill rate, variability of demand, lead time, and forecast accuracy.
- Using “continuous inventory review” formulas when very few companies actually perform continuous inventory review. Almost every company uses periodic inventory reviews, not continuous, so the formulas should be adjusted.
- Using averages to model lead times, production and quality performance when these variables follow statistical distributions.
- Define Inventory targets one level at a time when Inventory targets must be defined simultaneously for every level, class, stage, and location.
- Managing several business plans in parallel (sales, finance, manufacturing, …) instead of implementing an S&OP structured process to create ONE common plan to match demand with supply.
- Not involving Customers and Suppliers when Collaborative Planning and Forecasting is the only way to avoid the “whip effect”.

Facilities Cost Management

Optimizing Outbound and Delivery Costs Cost

Contract Management in Procurement
Inventory Management Model
While solutions to these problems are making their way into ERP systems, I have developed a simple inventory management model I call ABC-XYZ to align better the basic parameters of my planning system with my business goals.
I would like to explain in a very simple way some of the basic ideas behind the ABC-XYZ:
-
Not all items are born equal. Clustering and classifying data generates actionable information.
Some items have higher demand/consumption than others, different manufacturing lead times, production cycles and performance, or different material suppliers, etc. One common inventory management model to classify items for planning and inventory management is the ABC model. Essentially, the ABC model uses the Pareto rule that states that small percentage of the total number of items amount for a high percentage of the total value. For example, and over simplifying, 20% of the items (classified as A) amount to 70% of the total sales, 30% of the items (classified as B) amount to 20% of the sales, and the remain 50% of the items (classified as C) amount for the bottom 10% of sales. Most models assign to each class certain parameters and policies.
I always thought that this classification was incomplete. Let’s think of an A item with an annual demand of 12,000 units that have a very steady monthly sales volume around 1000 units and another A item that has a demand of 12,000 units that is sold in 2 lots of 6,000 in two unpredictable months. Can we use the same strategy, let’s call it the “A” strategy, for both items?
To solve this problem, I decided to add a second dimension to inventory classification, that I call XYZ based on the variability of demand. Items are classified in a matrix with ABC classification in one axis and XYZ in another axis. The XYZ classification is based on the standard deviation of the demand (I use frequently -6 periods in the past, +6 periods in the future). The variability factor is calculated as a percentage dividing the standard deviation (SD) by the total demand/consumption (TD) for the same period.
As a rule, I define X items those with SD/TD<0.10, Y items 0.10<SD/TD<0.25 and Z items with ratio over 0.25. Each company will need to set these values.
The fill rate target, inventory policy and all other parameters will be defined for each one of the nine classes. In the following table fill rate targets are defined based on ABC and XYZ:
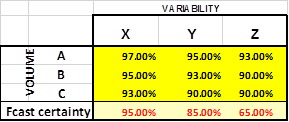
Forecast certainty refers to the forecast accuracy of the demand of the item. Each XYZ class has a different forecast accuracy.
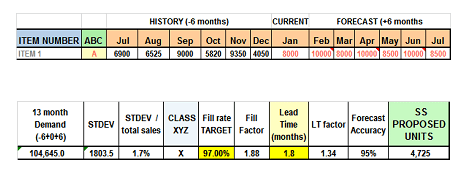
- Safety stocks are a function of the target fill rate, variability of demand, lead time and forecast accuracy, and should NOT be calculated using period demand or time buckets. The formula I use is the following:
SS = f(Fill Rate) * f(variability of demand) * f(lead time) / f(certainty)
f(Fill Rate): Inverse of the cumulative standardized normal distribution (NORMSINV function in Excel)
This factor is defined for each item based on the ABC-XYZ classification.
f(Variability of demand) : Standard deviation of demand for T periods
f(Lead time): Square Root of the Lead Time
f(certainty): Forecast accuracy
Example: Let’s calculate the safety stock for ITEM 1 with the following “-6 months+0+6 months” history/forecast using the ABC-XYZ table above, assuming that the Lead Time is 1.8 months.
-
Lot sizes should be calculated as follows:
- AX, AY and BX items. Dynamically calculated based on inventory carrying costs, total demand, and set-up costs for manufactured items and ordering cost for purchased items. A good inventory management model to use as reference is the EOQ (Economic Order Quantity) model that balances the total cost of releasing an order with the inventory carrying cost. The formula for EOQ is the following:
EOQ =SQRT[(2*Total demand*Setup Cost) / (Unit Cost*%Inventory Carrying cost)]
Let’s calculate the EOQ for our ITEM 1:
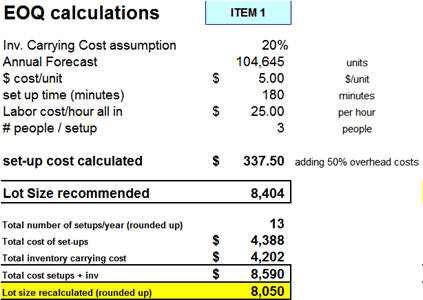
-
All other items. Lot should be calculated based on time buckets to balance the mix-model plan as explain in 4.
- Mix-Model strategies should also be utilized based on the ABC-XYZ classification to decide which MRP strategies to use to calculate the lot size and frequency of orders. An example could look as follows:
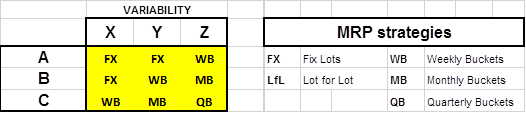
The “Steady Eddy” AX’s could be planned with fix predetermined lot sizes while the “unpredictable” CZ’s orders were planned combining all forecasted demand for the next quarter. The Mix-Model plan would generate eventually a relatively stable plan where every day (or week or month) would produce a percentage of each mix strategy (FX, WB, QB).
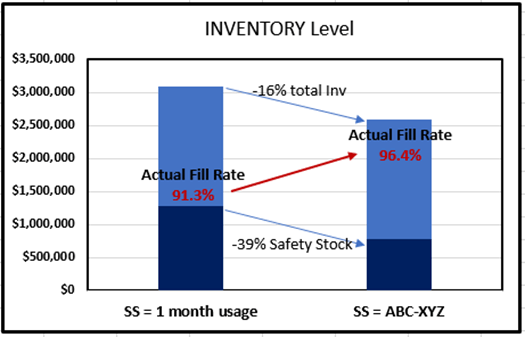
The conclusion of this post is that variability is a very important factor for the definition of the basic parameters to manage a supply chain. To incorporate variability into the master data, a process must be added to calculate at least safety stocks and lot sizes correctly. The ABC-XYZ inventory management model is a good model to improve fill rates with more optimal inventory levels. The following chart shows the result of applying the Inventory Management Model in a real case where the fill rate when up from 91.3% to 96.4%, and total inventories were reduced by 16% with safety stock reduction of 39%
Safety Stock Models compared:
- Safety Stocks = 1 month demand
- ABC-XYZ inventory management model applied independently for every node in the supply chain
I hope that standard ERP systems evolve quickly to calculate dynamically safety stocks and lot sizes as they contain already all needed data. These systems should also be able to simulate different inventory policies. I am convinced that Machine Learning Algorithms, as part of Big Data, will make its way into SCM management systems in the short term and will have a significant impact on Inventory Management.
About Author:
Pedro Caceres – www.OperationalSuccess.com
Recommended Readnig:
Inventory Management Explained: A focus on Forecasting, Lot Sizing, Safety Stock, and Ordering Systems

![]()
Essentials of Inventory Management

![]()
Achieving Effective Inventory Management, 5th ed

![]()
About the Author- Dr Muddassir Ahmed
Dr MuddassirAhmed is the Founder & CEO of SCMDOJO. He is a global speaker, vlogger and supply chain industry expert with 17 years of experience in the Manufacturing Industry in the UK, Europe, the Middle East and South East Asia in various Supply Chain leadership roles. Dr. Muddassir has received a PhD in Management Science from Lancaster University Management School. Muddassir is a Six Sigma black belt and founded the leading supply chain platform SCMDOJO to enable supply chain professionals and teams to thrive by providing best-in-class knowledge content, tools and access to experts.
You can follow him on LinkedIn, Facebook, Twitter or Instagram
