
Are you responsible for measuring key performance indicators for the procurement department in your organization?
Welcome to the ultimate solution for mastering Procurement metrics – our Procurement KPI Dashboard Excel template. This powerful tool is meticulously crafted to redefine how you comprehend and measure essential metrics in your Procurement process. With easy customization options, it puts you in control of monitoring, measuring, and optimizing Key Performance Indicators crucial for your business success.
The pivotal Procurement metrics dashboard aids in maintaining SMART (Specific, Measurable, Attainable, Realistic, and Timely) targets, driving Continuous Improvement within your Business and Supply Chain. As stated by Handfield et al. (2009), this Dashboard’s benefits encompass:
- Systematic measurement, leading to improved performance.
- Enhanced communication throughout the supply chain.
- Identification of areas for enhancement.
- Provision of opportunities for feedback.
- Boosting motivation and aligning behavior toward the anticipated outcomes.
“If you cannot measure it, you cannot improve it” – Lord Kelvin.
Procurement KPIs serve as a performance measurement tool capable of evaluating and monitoring an organization’s procurement management efficiency. This Procurement KPI Dashboard Excel template assists corporations in optimizing and controlling spending, quality, time, and costs.
Moreover, procurement KPIs aid businesses in tracking their overarching process goals, procurement strategies, and business objectives.
Key Features and Reasons to Buy:
Unlock the potential of your Procurement process with our KPI Dashboard Excel template, offering:
- SMART Target Maintenance: Ensures Specific, Measurable, Attainable, Realistic, and Timely targets are consistently met.
- Continuous Improvement Driver: Facilitates ongoing enhancements within your business and supply chain.
- Effective Communication: Fosters improved communication across the entire supply chain.
- Identifying Enhancement Areas: Pinpoints areas for improvement for strategic growth.
- Feedback Opportunities: Provides opportunities for valuable feedback loops.
- Motivation and Alignment: Boosts motivation and aligns behavior towards anticipated outcomes.
- Effortless Customization: Tailor the dashboard to fit seamlessly with your unique business needs.
- Optimizing and Controlling Spending: Streamlines processes to optimize and control procurement costs.
- Quality, Time, and Cost Management: Assists in achieving excellence in quality, time, and cost parameters.
- Time Efficiency: Save valuable time by automating the measurement and monitoring of KPIs. This allows your team to focus on strategic tasks rather than routine data collection. You can save 6-8 days of dashboard production time.
- Industry Best Practice: The Supply Chain KPI Dashboard shows all standard supply chain KPIs used in many industrial verticals.
Procurement KPIs are more than just metrics; they are the key to evaluating and monitoring your organization’s procurement management efficiency. Our template ensures you stay on top of your procurement strategies, overarching process goals, and business objectives.
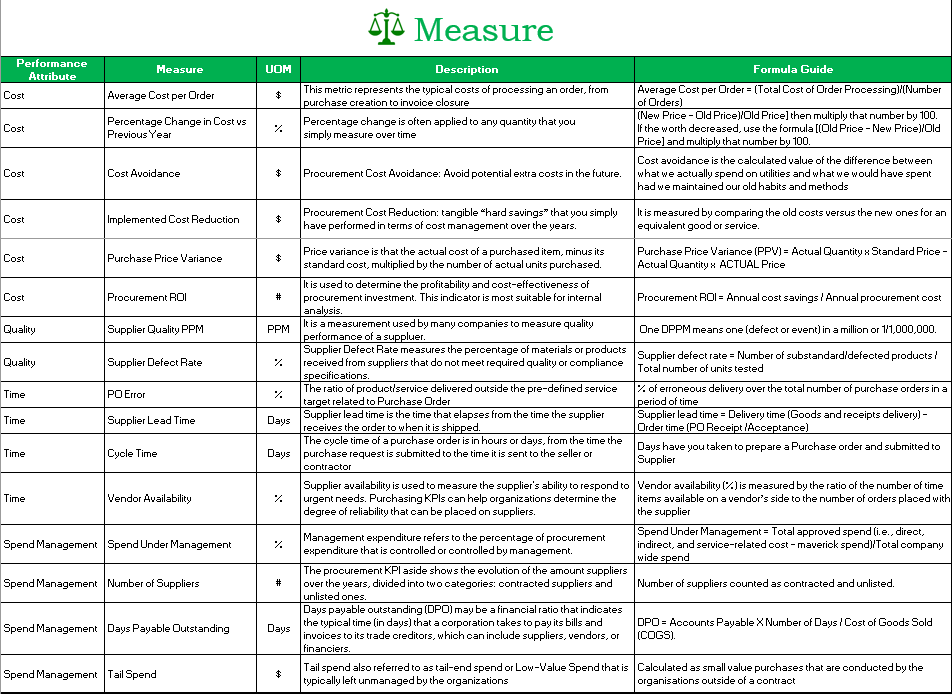
Recommended Procurement KPIs
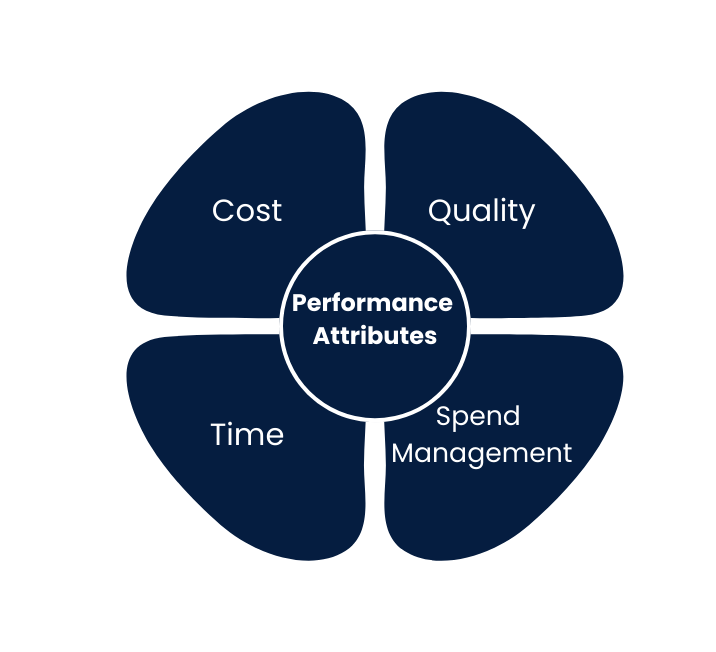
I could have compiled a list of 30+ Procurement KPIs across various categories within Procurement. However, drawing from over 16 years of experience, I’ve curated a selection of 16 Procurement KPIs organized under the following Performance Attributes. This list should comprehensively address all essential aspects of the Procurement Function.
Create Your Supply Chain KPIs in Excel
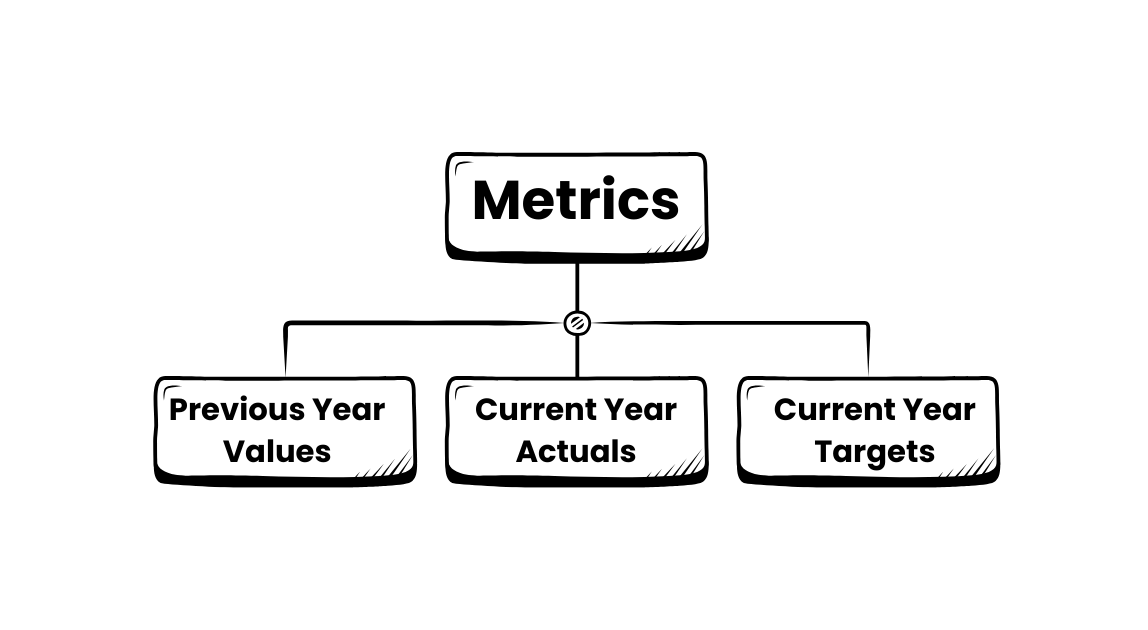
As you have identified additional KPIs in the Actual Sheet, you will need to set targets for your teams for these KPIs in the next sheet i.e. Target Sheet. This will make it easier for you to make comparisons with year-to-year values and future target values.
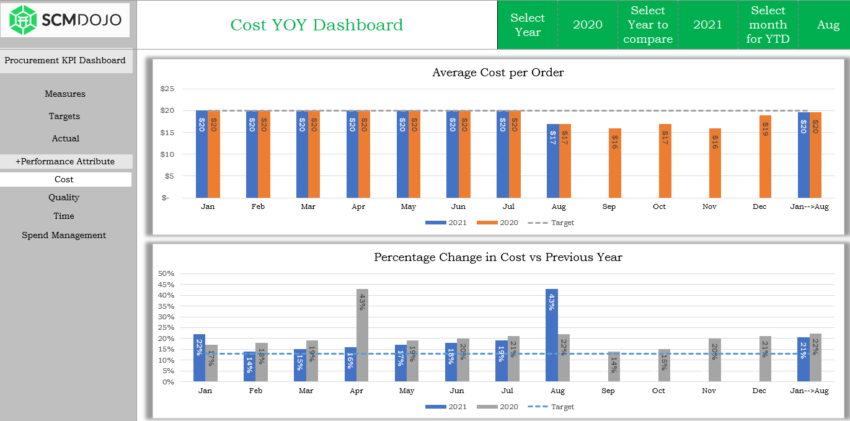
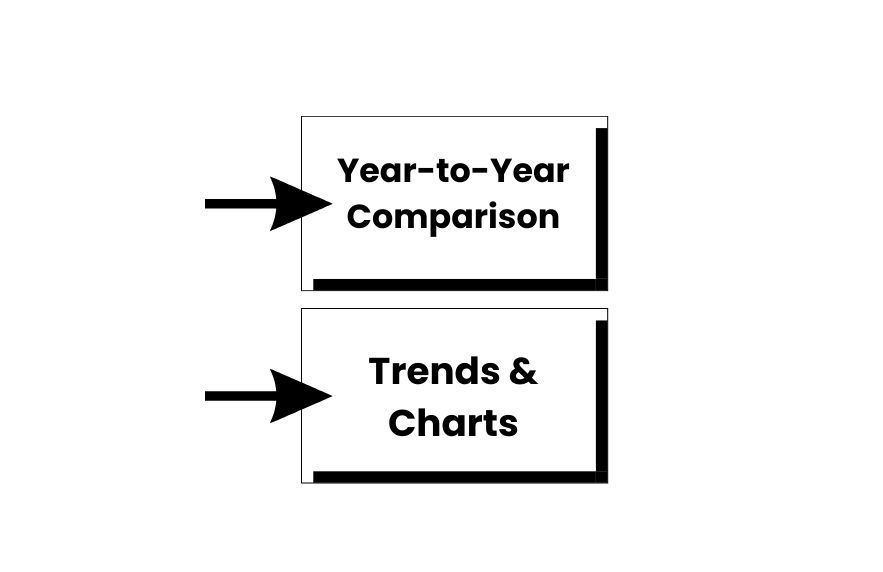
Furthermore, the next few sheets will give you a visual representation of the values that will help you understand trends forming in the available charts. It will visually represent the team’s effort and work on one screen. The KPI charts would tell you the summary:
- Cost
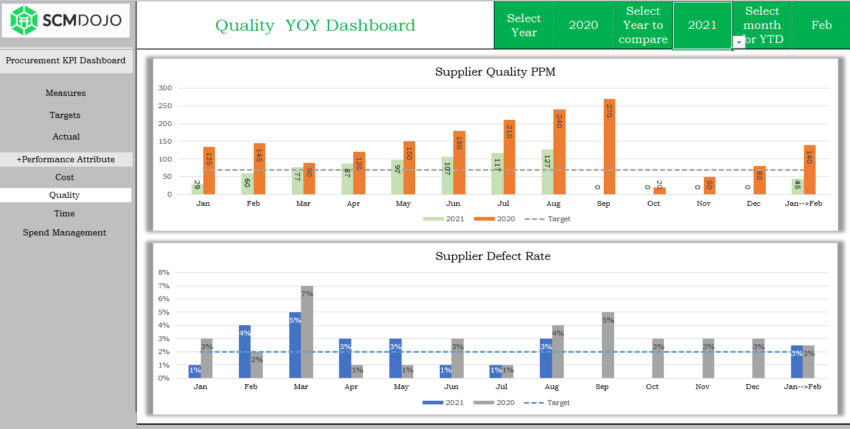
- Quality
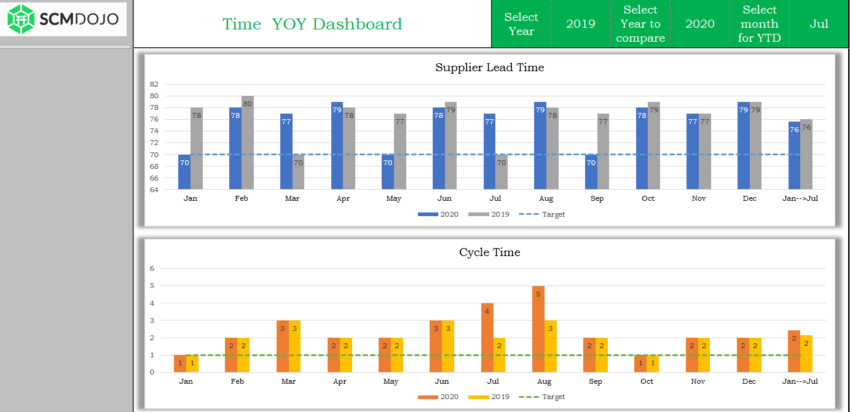
- Time
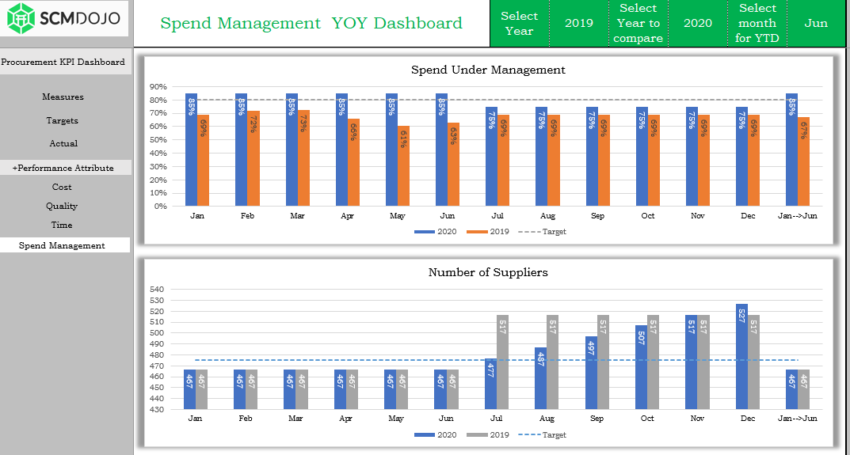
- Spend Management
Input
Output
Frequently Asked Questions (FAQs):
Q: What makes this Procurement KPI Dashboard Excel template unique?
A: Our template offers customization, facilitating tailored solutions for your business.
Q: How does this dashboard contribute to Continuous Improvement?
A: It systematically measures and identifies areas for enhancement, driving ongoing improvement.
Q: Can I use this template for different procurement strategies?
A: Absolutely, it is designed to adapt to various procurement strategies and objectives.
Q: How does this template help in controlling procurement costs?
A: By providing real-time insights, it empowers you to optimize and control spending effectively.
Q: Is technical expertise required to use this Procurement KPI Dashboard?
A: No, it is user-friendly, ensuring easy navigation and customization for all users.
Q: How can I access or modify data entry (Master Data)?
A: Click on View, then select Header. Unhide columns O to AH. You will then be able to access the data entry/Master Data. A concise PowerPoint presentation is also available for download, outlining the steps.
Recommended Reading Linked with Procurement KPI Dashboard Examples
Top 18 Supply Chain KPIs for the Supply Chain Team
17 Most Common Procurement Problems and Their Solution
27 Best Procurement Blogs and Websites You Should Bookmark
21 Authentic Procurement Interview Questions and Answers Guide
What is MRO? – All You Need to Know
3 Types of Supplier Segmentation Matrix You Can Use to Classify Suppliers
References
References:
Brewer, P. C., & Speh, T. W. (2000). Using the balanced scorecard to measure supply chain performance. Journal of Business Logistics, 21(1), 75.
Dilbert ‘Performance Measurement at: https://dilbert.com/strip/1996-07-18 and Handfield, et al. (2009)
Procurement KPI Dashboard Demo & Tutorial
Access our Best Practices on our Website!

Ratings and Reviews
There are no reviews yet. Be the first one to write one.
No reviews found.