The Procurement KPI Dashboard Built the Way Procurement Teams Actually Work
Stop rebuilding your procurement performance reports from scratch every month. This Excel-based KPI dashboard gives you pre-built visuals across cost, quality, time, and spend, SMART targets included, charts ready to present, and no BI licence required.
Instant download · Excel (.xlsx) · 16 pre-built KPIs · SMART target tracking · Lifetime access
Your procurement data is sitting there.
The performance story isn't.
From scattered metrics to a single procurement scorecard, in hours
Every procurement team is expected to measure performance. Finance wants cost savings figures. Operations wants delivery reliability. Leadership wants a clear view of supplier compliance and spend efficiency. The data usually exists somewhere, spread across ERP exports, shared drives, and manually updated spreadsheets that only one person fully understands.
A good procurement KPI dashboard pulls those numbers into a single, structured view: targets alongside actuals, trends over time, and a consistent methodology your whole team can work from. It should cover cost, quality, time, and spend, and it should be something you can open in front of a CFO without apologising for the formatting.
This template is that tool. Built by a practitioner with 19+ years in procurement and supply chain, it reflects the KPI frameworks used in real transformation projects, not textbook theory. Enter your data, set your targets, and your procurement dashboard is ready to present.
Are we saving what we planned?
Track actual cost savings against targets, period by period, with visual trend lines.
How reliable are our suppliers?
On-time delivery, lead time variance, and quality rejection rates, all in one place.
Is spend under control?
Spend under management and maverick spend metrics tell you where buying discipline is slipping.
Where are we off-target?
SMART target tracking flags which KPIs are underperforming before they become urgent problems.
Every procurement KPI your team needs, pre-built and ready
Enter your actual data, set your targets, and the dashboard charts update automatically. No pivot tables to configure, no formulas to write from scratch.
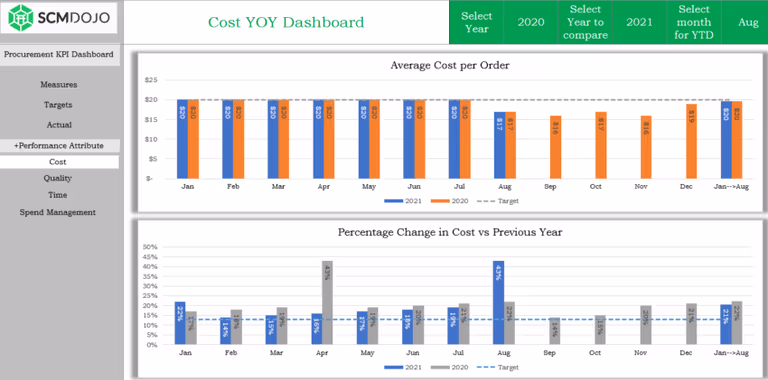
Cost KPI Dashboard
Track cost savings, cost avoidance, and purchase price variance against SMART targets, with monthly trend charts.
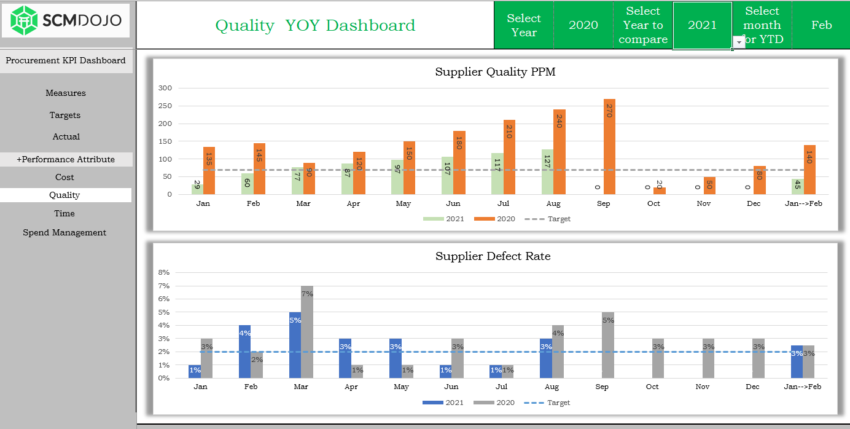
Quality KPI Dashboard
Supplier defect rate, rejection rate, and quality compliance, visualised with actuals vs. targets per period.
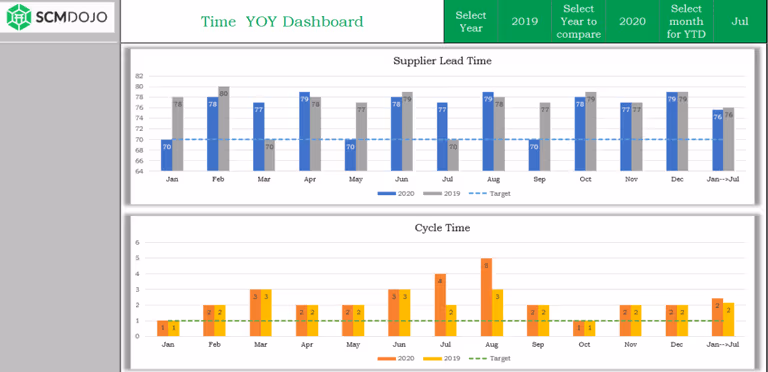
Time KPI Dashboard
On-time delivery, lead time, and purchase order cycle time, know your delivery reliability before every supplier review.
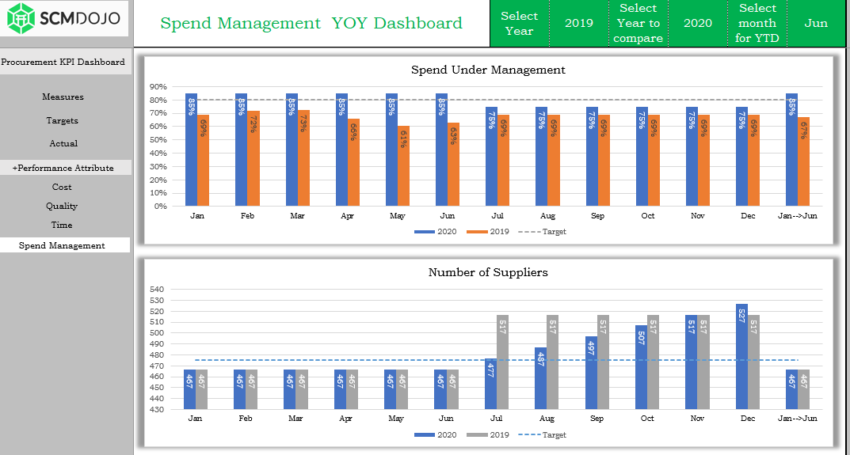
Spend Management KPI Dashboard
Spend under management, maverick spend, and contract compliance rate, in one clean view for finance and leadership.
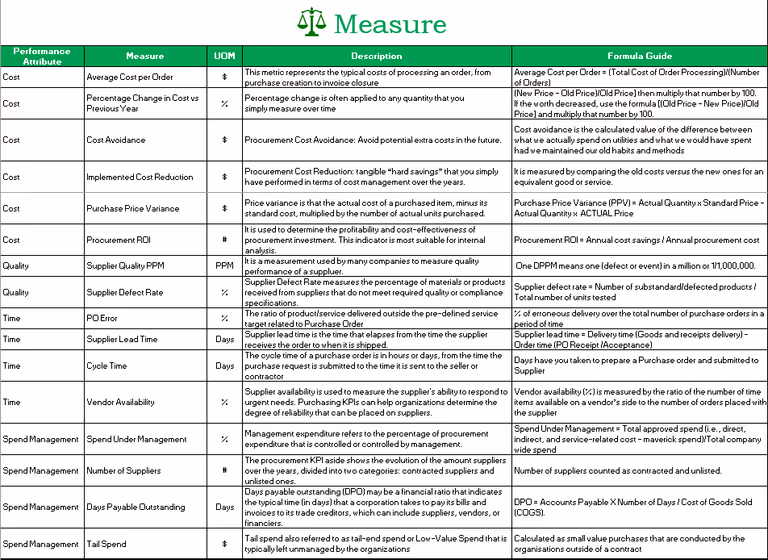
16 Recommended Procurement KPIs
Industry-standard KPIs pre-configured across all four dimensions. Add your own to extend the framework.
SMART Target Tracking
Set specific, measurable targets for each KPI. The dashboard shows instantly which metrics are on track and which need attention.
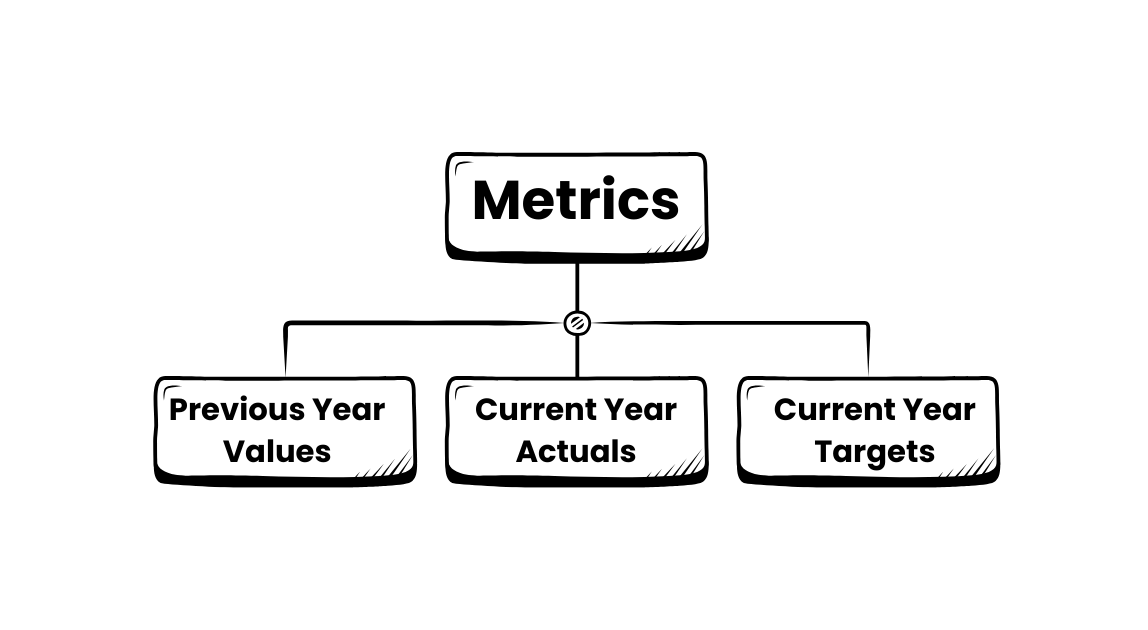
Current Year vs. Last Year vs. Target
Three-way comparison built into every chart, the format leadership expects without any extra work from you.
Master Data Input Sheet
A single structured input sheet for all your actuals and targets. Includes a step-by-step guide on how to access and amend it.
Presentation-Ready Charts
Clean, professional charts suitable for leadership decks, QBRs, and monthly procurement reviews, no redesign needed.
Fully Customisable Structure
Add your company name, adjust KPI names to match your taxonomy, and define your own target periods. The template is fully editable and unlocked.
Performance visuals for every KPI your team tracks
A visual procurement KPI dashboard means faster decisions, cleaner reporting, and no more explaining raw numbers to leadership.


See the Procurement KPI Dashboard in action, under 10 minutes
Watch Dr. Muddassir Ahmed walk through the four KPI dimensions, show how to enter your data, and demonstrate how the dashboard updates in real time.
See what you'll be working with
Each dashboard sheet is pre-configured with charts, targets, and trend comparisons. Here is a closer look at the key views inside the procurement KPI dashboard template.


Designed for procurement practitioners.
Not data scientists.
Simple data entry
Enter your actuals and targets into the Master Data sheet. No complex formulas to write, no ERP integration required, works with any data you can type or paste.
SMART target tracking
Set specific, measurable targets per KPI per period. The dashboard instantly shows which metrics are on track, which are lagging, and by how much.
Four KPI dimensions
Cost, quality, time, and spend management, the four pillars of procurement performance, each with their own dedicated dashboard sheet and chart set.
Year-on-year comparison
Every chart compares current year actuals against last year and your target. The three-way view your CFO will ask for, already built in.
Saves 6–8 days of build time
Building a procurement KPI dashboard from scratch in Excel takes most analysts a full working week. This template cuts that to a few hours of data entry.
Fully customisable
Rename KPIs, adjust targets, add your company logo, and extend the template with your own metrics. It is fully editable and unlocked.
From raw data to procurement insight in four steps
Open the Master Data sheet
Enter your actual KPI figures and targets for each period. The guide PDF walks you through every column.
Set your SMART targets
Define specific, measurable targets for each KPI. The dashboard automatically flags which metrics are on or off track.
Navigate the four dashboards
Review cost, quality, time, and spend views. All charts update instantly from your Master Data input.
Present & drive improvement
Your procurement KPI dashboard is ready for leadership, QBRs, or supplier reviews, no reformatting needed.
Built for the people who have to
present procurement performance to leadership
Track supplier KPIs before your next quarterly review
Stop pulling numbers from three different spreadsheets. This dashboard gives you cost, quality, and delivery KPIs in one place.
Walk into the board with a clean procurement scorecard
Show actuals vs. targets vs. last year across all four dimensions, without asking your analyst to rebuild the deck overnight.
Replace the monthly rebuild with a permanent reporting process
Enter new data each month and every chart updates. No reformatting, no formula hunting.
Deliver a client KPI baseline in the first week of an engagement
Load client data, identify performance gaps across all four dimensions, and present findings fast.
Every procurement KPI question people ask,
answered by your own data
Procurement teams, and the AI tools they use, get asked these questions constantly. This dashboard gives you the structured output to answer all of them, with your own data, quickly.
The 16 most widely used procurement KPIs span four dimensions: cost savings, quality compliance, on-time delivery, and spend under management. This dashboard tracks all 16 with SMART targets built in.
Building one from scratch takes 6 to 8 days. Or download this template, enter your data in the Master Data sheet, and every chart is ready in hours.
By making performance gaps visible each period, the dashboard creates a structured basis for supplier conversations, process changes, and prioritised corrective action.
Enterprise tools need IT, budget, and months to deploy. This Excel procurement KPI dashboard is operational in hours, costs $59, and requires no technical setup.
The cost dimension tracks cost savings, cost avoidance, and purchase price variance, each compared against your defined target for the period, month by month.
Spend under management is the percentage of total spend actively managed through contracts or approved suppliers. The spend dashboard in this template tracks it alongside maverick spend and contract compliance.
Built by a practitioner who has lived
the KPI reporting problem firsthand
Everything you need to know
What makes this procurement KPI dashboard different from a standard Excel template?
Four dedicated dashboards, 16 pre-configured KPIs, SMART target tracking, and year-on-year comparison, all driven from a single data input. Not a blank chart sheet.
Do I need advanced Excel skills to use it?
No. If you can type numbers into a spreadsheet, you can use this. The included guide covers every step from opening the file to presenting the finished dashboard.
Can I add my own KPIs or rename the existing ones?
Yes. The file is fully unlocked and editable. Rename KPIs, adjust target periods, and add your company logo directly in the dashboard sheet.
How do I access and modify the Master Data sheet?
A second file is included with your purchase: a step-by-step PDF guide covering exactly how to access, navigate, and update the Master Data input sheet.
Can I use this for different procurement categories or business units?
Yes. The structure is flexible enough to adapt to different categories, supplier groups, or business units. Adjust labels to match your organisation's structure.
What format will I receive after purchase?
An instant download link to the .xlsx Excel file plus the PDF guide. Works on Excel 2016 or later, Windows and Mac, including Microsoft 365.
Do you offer team or enterprise licensing?
For team-wide deployment or enterprise licensing, contact us at [email protected].
Stop building procurement reports from scratch. Start measuring what matters.
Download your procurement KPI dashboard template now and transform your performance reporting from scattered spreadsheets to executive-ready dashboards.
Instant download · Excel (.xlsx) · PDF setup guide · Lifetime access · 16 pre-built KPIs
