Transportation Cost Analysis Real-Life Excel Model
Stop estimating what your network should cost to run. This fully-structured Excel model shows exactly how transportation cost is calculated across your Plant-to-DC and DC-to-Customer network, runs a live Solver optimization to find your lowest-cost shipment plan, and validates every constraint automatically, so your numbers hold up in the boardroom.
10 Interconnected Sheets · Solver-Optimized · Instant Download

A complete transportation cost analysis, not a single spreadsheet formula
Everything you need to model, optimize and present your network's transportation cost, pre-built and ready to run.
10-sheet Excel workbook (.xlsx)
Pre-loaded with a real 5-customer, 4-plant network example
Two-leg cost model: Plant → DC and DC → Customer
Distances calculated from latitude/longitude, editable with actuals
Live Excel Solver optimization, set up step by step
Automatic validation of every supply, demand and flow-balance constraint
Built-in scenario comparison (growth, disruption, new facility)
KPI dashboard with cost, utilization and scenario charts
What is transportation cost analysis?
Transportation cost analysis is the process of calculating and evaluating every cost involved in moving goods through a distribution network, typically Plant → Distribution Centre (DC) → Customer, so a business can identify the lowest-cost, feasible way to move product and defend that decision with data rather than gut feel.
How is transportation cost calculated?
Multiply the quantity shipped on each lane by the distance of that lane, then by a freight rate in cost per unit per kilometre, and sum across every lane. This template automates that with a SUMPRODUCT formula across both the Plant-to-DC and DC-to-Customer legs, plus any fixed costs and fuel surcharges.
How much should transportation cost?
There is no universal benchmark, cost as a share of revenue varies by weight, value density and network footprint. This model calculates your own cost per unit and per week, then lets you stress-test it under growth or disruption, so your benchmark is based on your data, not an industry average.
Route cost analysis vs. full network analysis
A route cost analysis usually looks at one lane in isolation. A full transportation cost analysis, as built here, evaluates every lane at once against shared plant capacity and customer demand, so optimizing one route does not quietly break the rest of the network.
Ten sheets. One complete network decision.
Every tab connects automatically. Change a demand figure, a distance, or a freight rate, and the cost calculation, constraint checks, and dashboard all recalculate.
Instructions
A plain-English walkthrough of every tab, the colour convention, and a full step-by-step Solver setup guide. Hand it to a junior analyst and they will be running the model within the hour.
Network Data
Your customers, plants, and the road distances between every node, pre-loaded with a working example so the model runs before you touch a single input.
- Customer demand and location by week
- Plant supply capacity and status
- Distances derived from latitude/longitude
- Editable freight rates, per unit per km
Optimization Model
The two decision-variable matrices, Plant-to-DC and DC-to-Customer, plus the full cost calculation Solver minimizes. Comes pre-loaded with a feasible starting allocation.
- SUMPRODUCT-based cost formula, no manual calculation
- Fixed-cost logic for a candidate plant or supplier
- Solver target cell and variable ranges clearly labelled
- Cost-per-unit calculated automatically
Constraints
Every supply limit, demand requirement, and DC flow-balance check is validated automatically, with a clear status so you know your plan is actually feasible before you present it.
Scenario Analysis
Baseline is live-linked to your current model. Three pre-built scenario rows, no candidate facility, demand growth, and supply disruption, let you log and compare alternatives without losing your working case.
Dashboard
Total cost, cost per unit, plant utilization, and a cost breakdown, all in KPI cards and charts. Print it, screenshot it, or present it directly.
A complete network cost model — from raw data to optimised allocation
Every tab connects automatically. Change a demand figure, a distance, or a freight rate and the cost calculation, constraint checks, and dashboard all recalculate instantly.
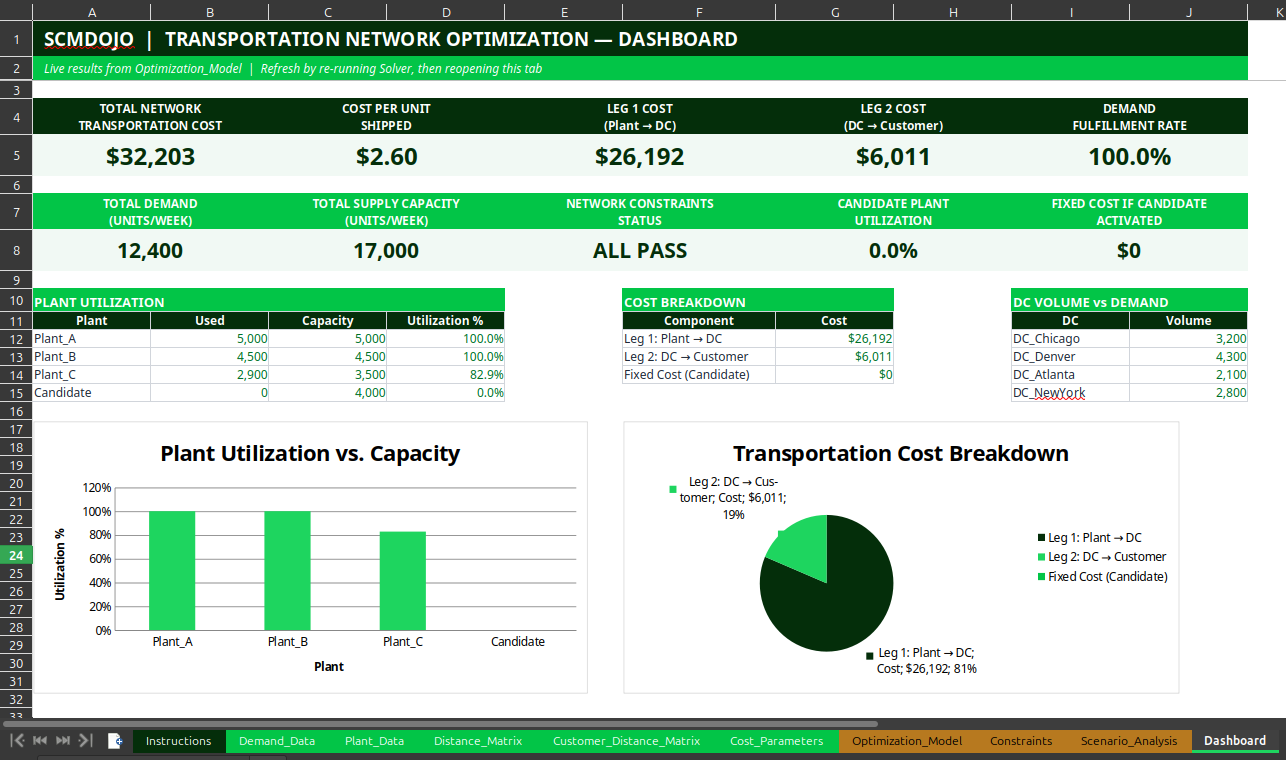
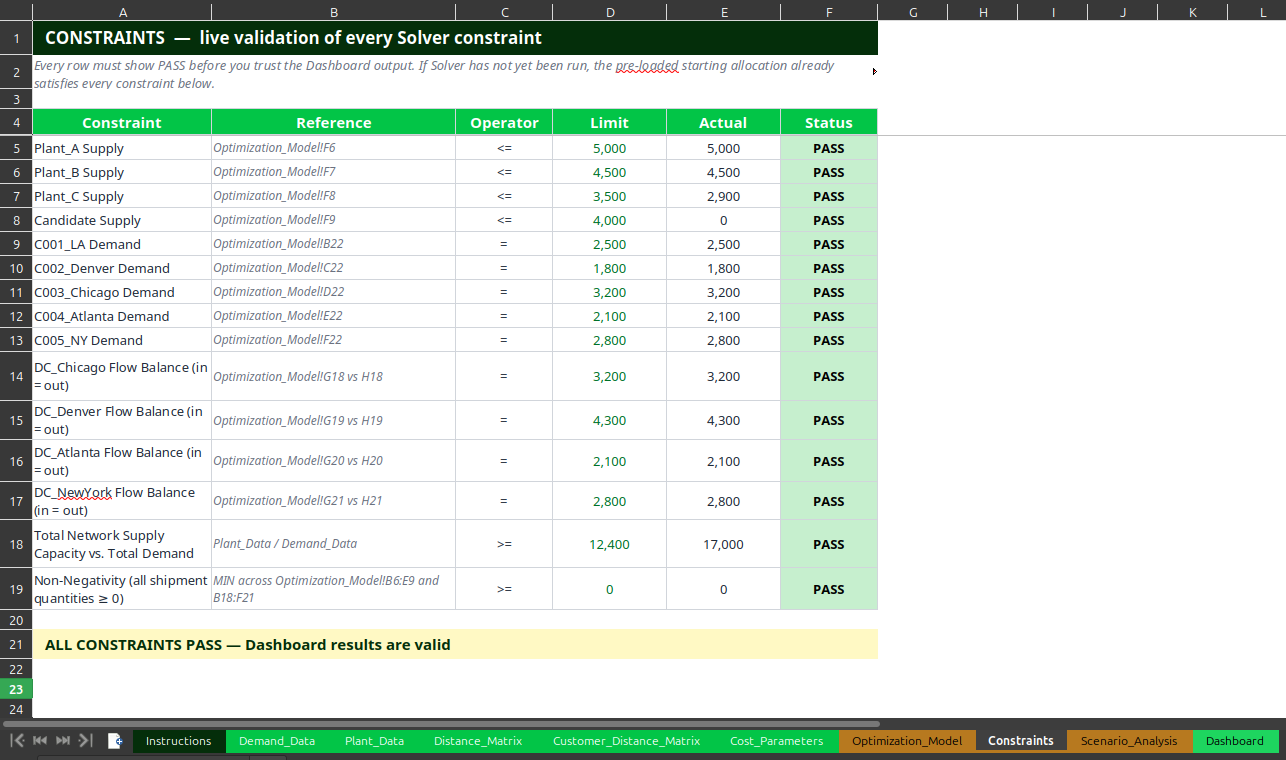
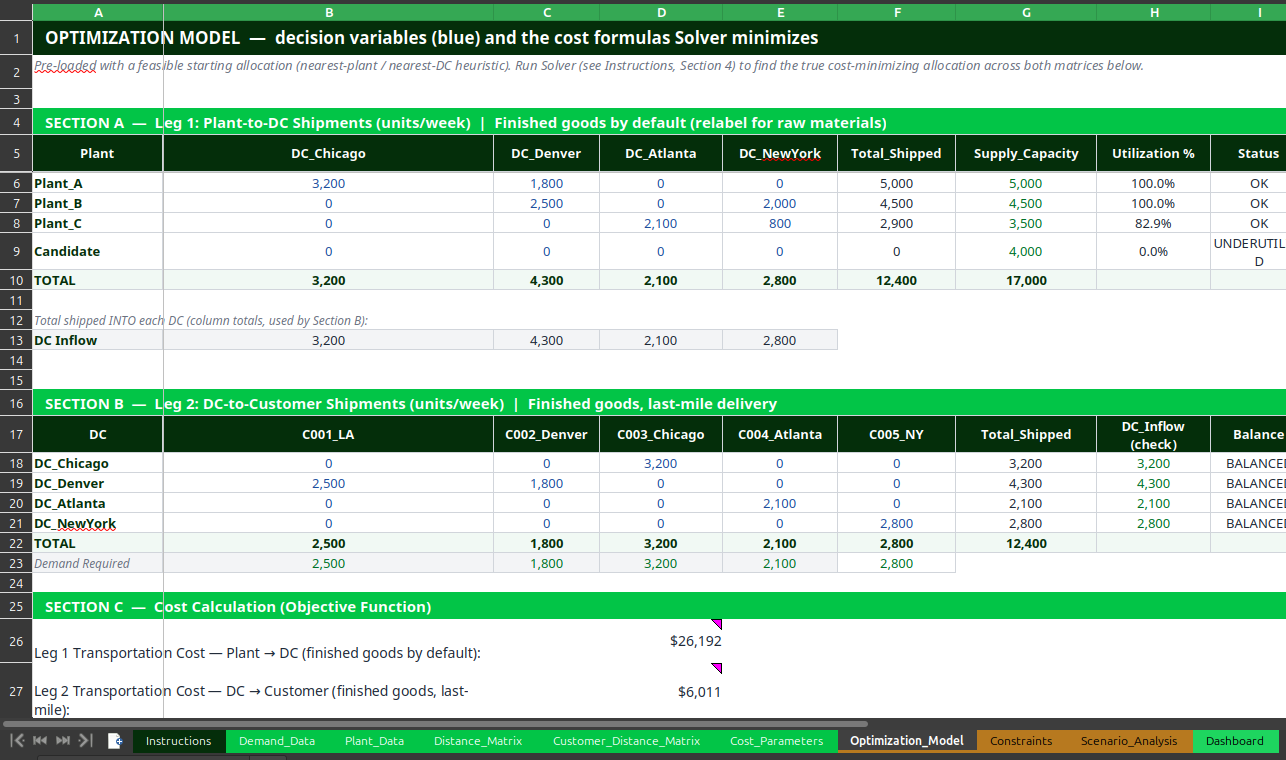
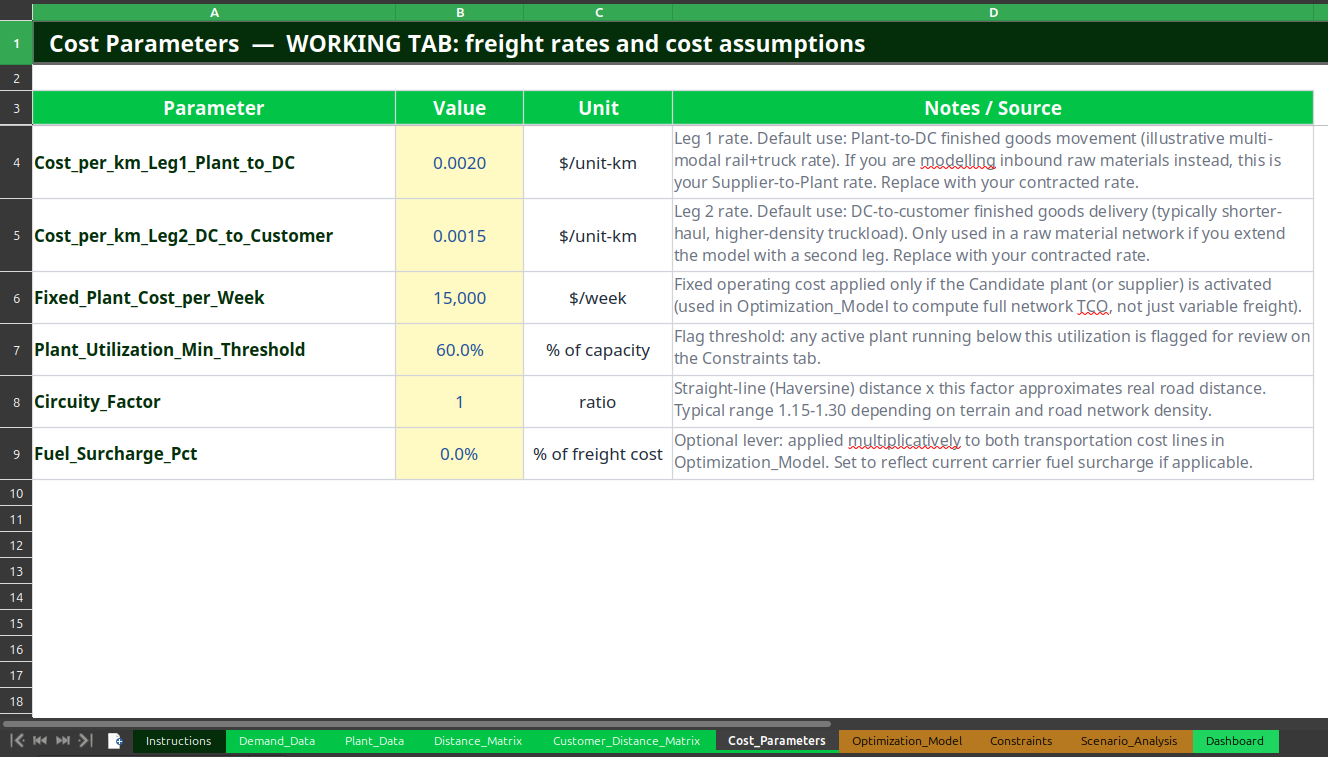
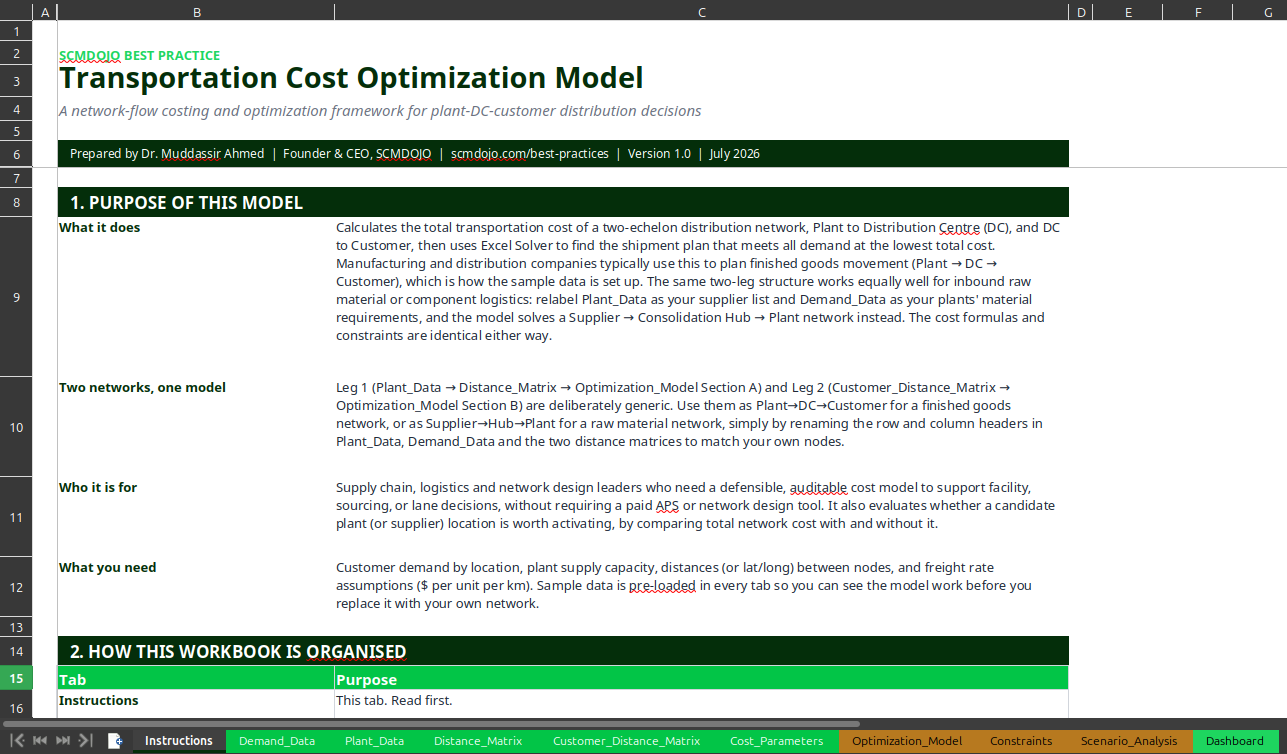
Every leg of the network. Nothing missing.
Most transportation cost analysis fails because it prices one leg of the network and ignores the other, or ignores capacity constraints entirely. This template prices both legs together.
LEG 1 Plant → DC
LEG 2 DC → Customer
Built for real logistics network decisions
Whether you run a distribution network, evaluate a new facility, or defend a freight budget, this template gives you the structured output your stakeholders expect.
Logistics & Transportation Managers
Running a recurring transportation cost analysis to defend freight budget and challenge carrier pricing with a network view, not just a lane-by-lane quote.
Manufacturing & Distribution Ops Teams
Deciding how to allocate shipments across existing plants and DCs, and quantifying the cost impact of a new facility before committing capital.
Supply Chain Network Design Consultants
Deploying a credible, client-ready cost and optimization model on engagements without rebuilding the Solver setup from scratch each time.
S&OP and Finance Business Partners
Producing a defensible cost-per-unit and total network cost figure for budget reviews, with a clear audit trail of every assumption used.
Procurement and Inbound Logistics Leaders
Relabelling the same two-leg structure to model a Supplier → Hub → Plant raw material network instead of finished goods distribution.
Students and Professionals in Training
Learning network-flow cost modelling and linear programming with a real, working Solver example. Ideal for supply chain and logistics certification study.
From download to a defensible cost figure in under an hour
The model is pre-loaded with a working example. Follow the steps in order.
Enter your network data
Go to Demand_Data and Plant_Data and replace the sample customers and plants with your own locations, weekly demand, and supply capacity.
Set your freight rate assumptions
Open Cost_Parameters and enter your own cost per unit per kilometre for each leg, plus any fixed cost and fuel surcharge that applies to your network.
Review the starting allocation
Open Optimization_Model. A feasible starting shipment plan is already there, so the Dashboard is never blank while you configure Solver.
Run Solver
Open Data → Solver, set the Total Network Transportation Cost cell to Minimize, and let Solver find the lowest-cost feasible shipment plan.
Validate constraints
Open the Constraints tab and confirm every supply, demand and flow-balance check shows PASS before you trust the result.
Read the Dashboard and log scenarios
Review the KPI cards and charts, then log alternative scenarios, such as removing a plant or a demand surge, in Scenario_Analysis.
Industry-standard colour coding throughout
The same convention used in professional financial models. Anyone familiar with Excel modelling standards knows exactly what to edit and what to leave alone.
Blue Text — User Inputs
These are the cells you change: demand, capacity, distances, freight rates.
Black Text — Formulas
Calculated cells. Do not edit. These update automatically when inputs change.
Green Text — Cross-Sheet Links
Values pulled live from another tab, confirming the model is wired correctly.
Yellow Fill — Key Assumptions
Rates and thresholds worth reviewing before you trust the output.
Questions answered
Do I need advanced Excel or Solver experience to use this template?
No. You need to be comfortable entering numbers into a spreadsheet. The Instructions tab walks you through every step in plain language, including a one-time Solver setup, and the model comes pre-loaded with a working example so you can see it run before you enter your own data.
Can I use this model for raw materials instead of finished goods?
Yes. The default example models finished goods moving from Plant to DC to Customer, the most common use case, but the two-leg structure is generic. Relabel Plant_Data as your supplier list and Demand_Data as your plants' material requirements, and the same formulas solve a Supplier-to-Hub-to-Plant raw material network instead.
What cost and benefit analysis techniques does this model use, and what are the implications for my decision?
The model combines linear cost estimation (SUMPRODUCT of shipment quantity and distance), Solver-based linear programming to find the lowest-cost feasible allocation, live constraint validation for supply, demand and flow balance, and scenario comparison for growth, disruption and facility investment decisions. Together, these techniques turn a single cost estimate into a defensible view of the cost implications of each network option, rather than a guess.
How are the distances between locations calculated?
Distances are calculated from each location's latitude and longitude using the Haversine (great-circle) formula, multiplied by a circuity factor (default 1.20) to approximate real road distance. Replace any cell with an actual carrier or routing-engine distance whenever you have one, actuals always beat an estimate.
What if Solver returns "no feasible solution"?
Check that your total plant supply capacity is at least equal to total customer demand, and that no single customer's demand exceeds the combined capacity of the plants that can reach it. The Constraints tab will show you exactly which check is failing.
Can I share this directly with my leadership team?
Yes. The Dashboard tab is designed for this. Screenshot it or present it directly, the KPI cards and charts update automatically from your Solver result, so what you present is always your current network, not a stale export.
Why every supply chain and logistics professional needs this
A rigorous transportation cost analysis combines sound cost-benefit analysis techniques, defensible estimates, and a clear view of the implications for your network, not a single number pulled from a spreadsheet built once and never revisited.
The Problem
Most transportation cost analysis prices one leg and ignores the rest
Teams cost the outbound lane, or the inbound lane, rarely both together, and rarely against shared plant capacity. The result looks right in isolation and falls apart at network scale.
Building a genuine network optimization model from scratch takes days
A rigorous model needs a two-echelon cost structure, Solver-based linear programming, constraint validation, and a stakeholder-ready dashboard. Building that from a blank sheet is a multi-day exercise for a senior analyst.
A cost-only view misses the constraint that makes a plan infeasible
The cheapest allocation on paper is worthless if it exceeds a plant's capacity or leaves a customer's demand unmet. Without live constraint checks, that error surfaces after the plan is already presented.
The Solution
A two-leg cost model built from real network-costing engagements
Plant-to-DC and DC-to-Customer priced together, with distance, freight rate, fixed cost and fuel surcharge all accounted for, so nothing is missing from the total.
Live Solver optimization from inputs to lowest-cost plan
Enter your network, run Solver, and the shipment allocation, total cost, and cost per unit update automatically. No manual iteration, no separate optimization software.
Automatic constraint validation on every plan you present
Fifteen live PASS / FAIL checks across supply, demand and flow balance confirm the plan you present is actually feasible, not just cheap on paper.
Typical estimate: building this two-echelon cost and optimization structure from scratch takes a senior analyst a full working day or more. Run this analysis every quarter, or on every new facility decision, and the time saved alone pays for the five minutes it takes to download this template.
Get the TemplateBuilt by a practitioner, for practitioners

Dr. Muddassir Ahmed
Dr. Muddassir Ahmed is the founder of SCMDOJO, a supply chain learning and intelligence platform serving professionals across 50+ countries. With deep experience in supply chain transformation, S&OP, and procurement consulting, spanning senior roles at Bridgestone, Doncasters Group, Eaton, and Volvo Cars, he built this template to reflect the analytical frameworks used in real client engagements, not textbook theory. Every cost line item, every constraint, and every formula in this model has been validated in the field.
Connect on LinkedIn →
Download the Transportation Cost Analysis Tool
A complete, boardroom-ready Excel model. Pre-loaded with a real example. Zero formula errors. Ready to run today.
One-time purchase · Instant download · Excel (.xlsx) · Lifetime access · No subscription


