The Logistics KPI Dashboard Built the Way Supply Chain Managers Actually Work
Stop rebuilding your logistics reports from scratch every cycle. This plug-and-play Excel template gives you a fully structured, dashboard-ready logistics KPI tool, time, cost, quality, productivity, safety, and culture KPIs, all tracked in one place, ready to present to leadership.
Instant download · Excel (.xlsx) · 25+ pre-loaded KPIs · Lifetime access
Your logistics data is sitting there.
The performance picture isn't.
From scattered operational data to logistics decisions, in minutes
Every logistics and supply chain team measures KPIs. Leadership asks about delivery performance, warehouse costs, and service levels. The data exists, in your WMS, your TMS, your spreadsheets. The problem is pulling it into one clear picture before the weekly ops meeting.
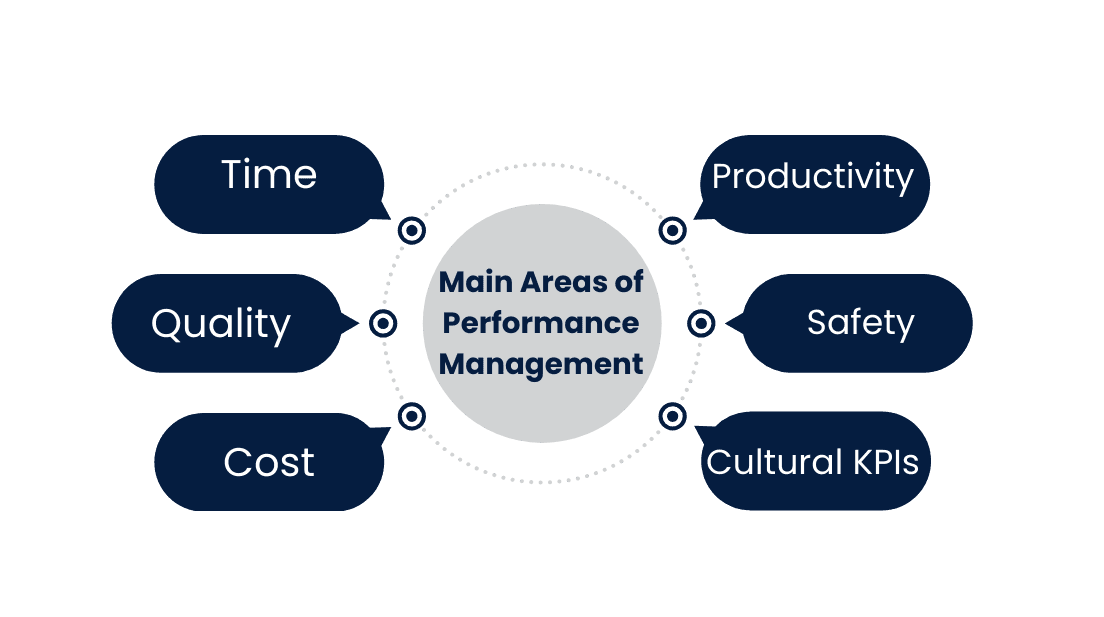
A good logistics KPI dashboard does more than display numbers. It covers all the dimensions that matter: how fast you move goods, what it costs, how accurately you do it, how productive your team is, how safe the operation is, and whether your culture supports improvement. Those six lenses give leadership a complete view.
This template is built by a practitioner, for practitioners. It reflects the same KPI frameworks used in logistics transformation projects and gives your team a repeatable reporting foundation, without rebuilding it every cycle.
Are we delivering on time?
Delivery lead time, on-time delivery rate, and order fulfilment speed, tracked per period.
What is logistics costing us?
Warehouse cost per unit, transportation cost, and cost as a percentage of revenue, all visible.
How accurate are our operations?
Receiving accuracy, order picking accuracy, and inventory accuracy tracked against targets.
Is our operation safe?
Near-miss reporting and safety KPIs surface operational risk before it becomes a headline.
Every KPI your logistics team needs, pre-built across six dimensions
Enter your operational data into the Input sheet, and every KPI dashboard updates automatically. No formulas to write. No charts to configure. No cycle spent rebuilding the same report.
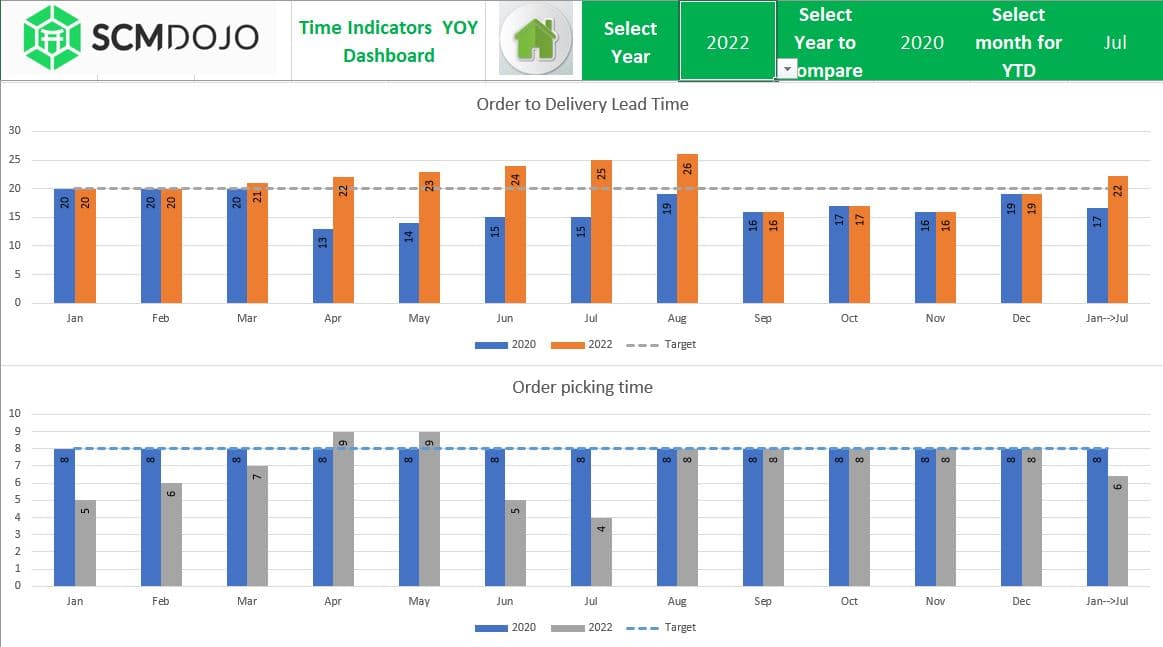
Time KPI Dashboard
Delivery lead time, on-time delivery rate, and order cycle time, tracked against target and prior period.
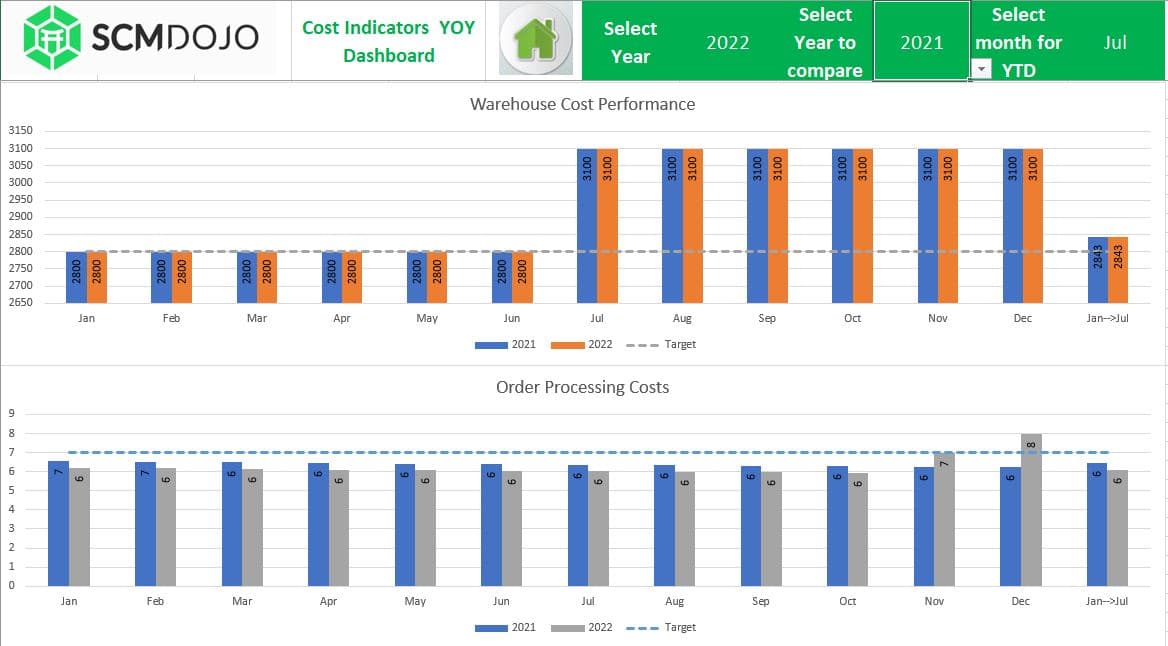
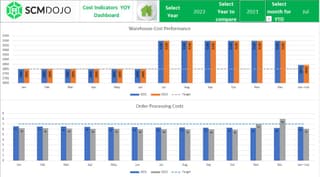
Cost KPI Dashboard
Warehouse cost per unit, cost as a percentage of revenue, and transportation cost performance, all in one view.
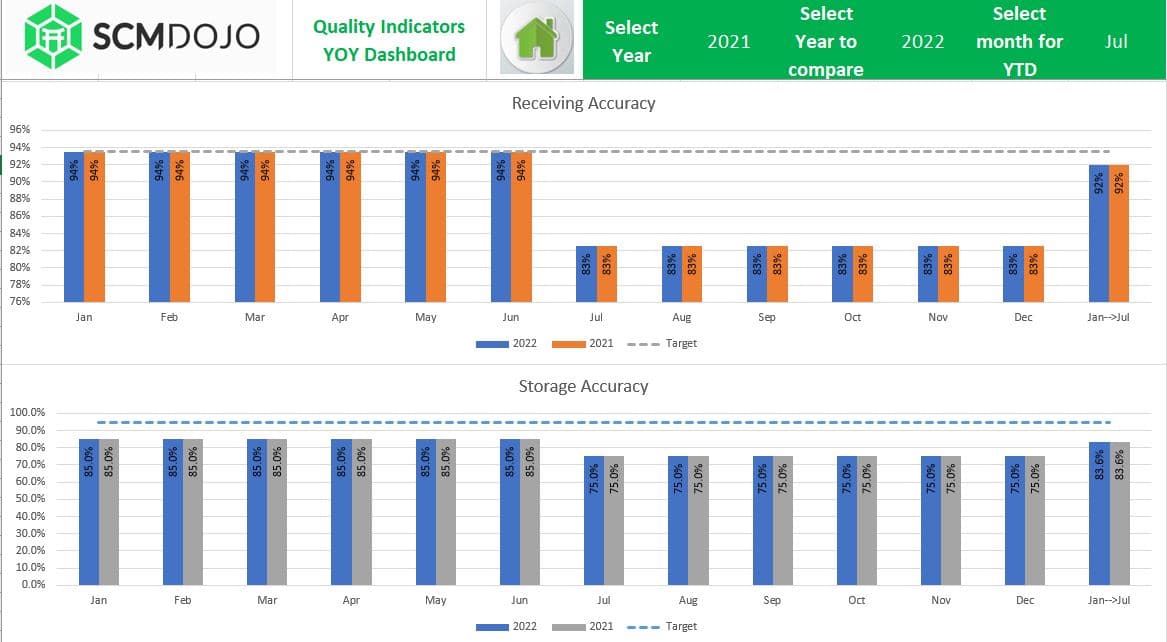
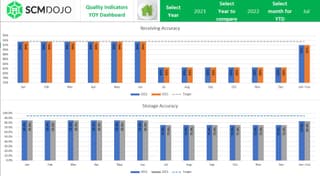
Quality KPI Dashboard
Receiving accuracy, order picking accuracy, and inventory accuracy, measure quality at every stage of the logistics flow.
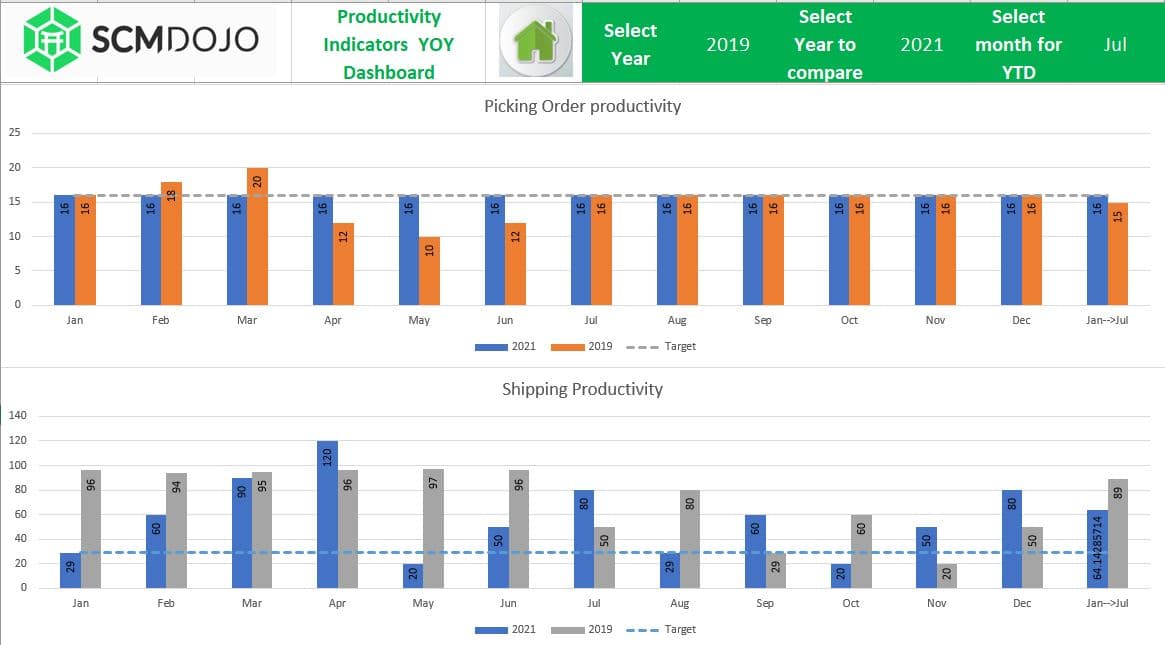
Productivity KPI Dashboard
Lines picked per hour, labour productivity, and throughput rates, know how efficiently your team and equipment are working.
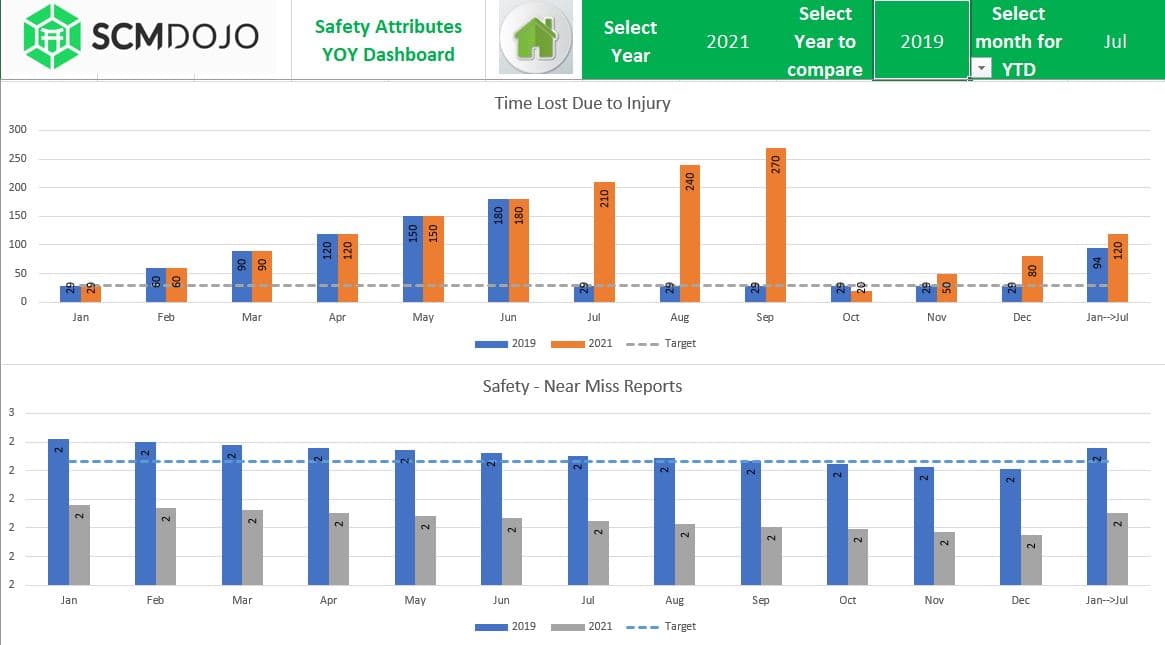
Safety KPI Dashboard
Near-miss reporting, incident rates, and safety attributes, surface operational risk before it escalates.
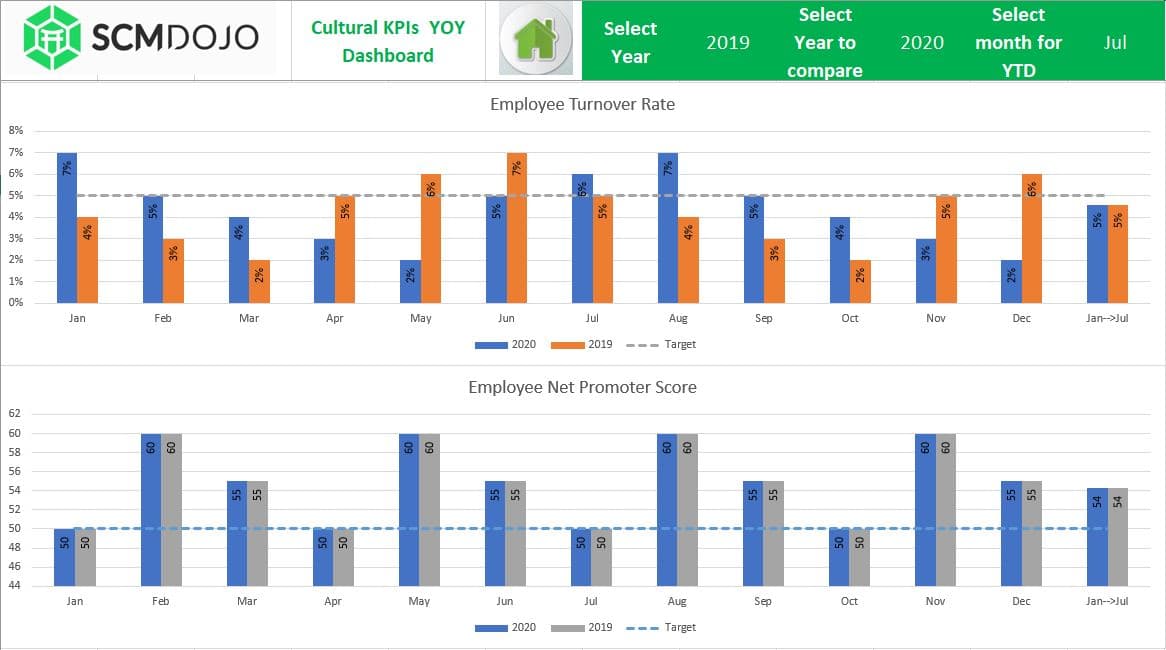
Culture KPI Dashboard
Employee turnover, absenteeism, and engagement metrics, the people indicators that predict operational performance over time.
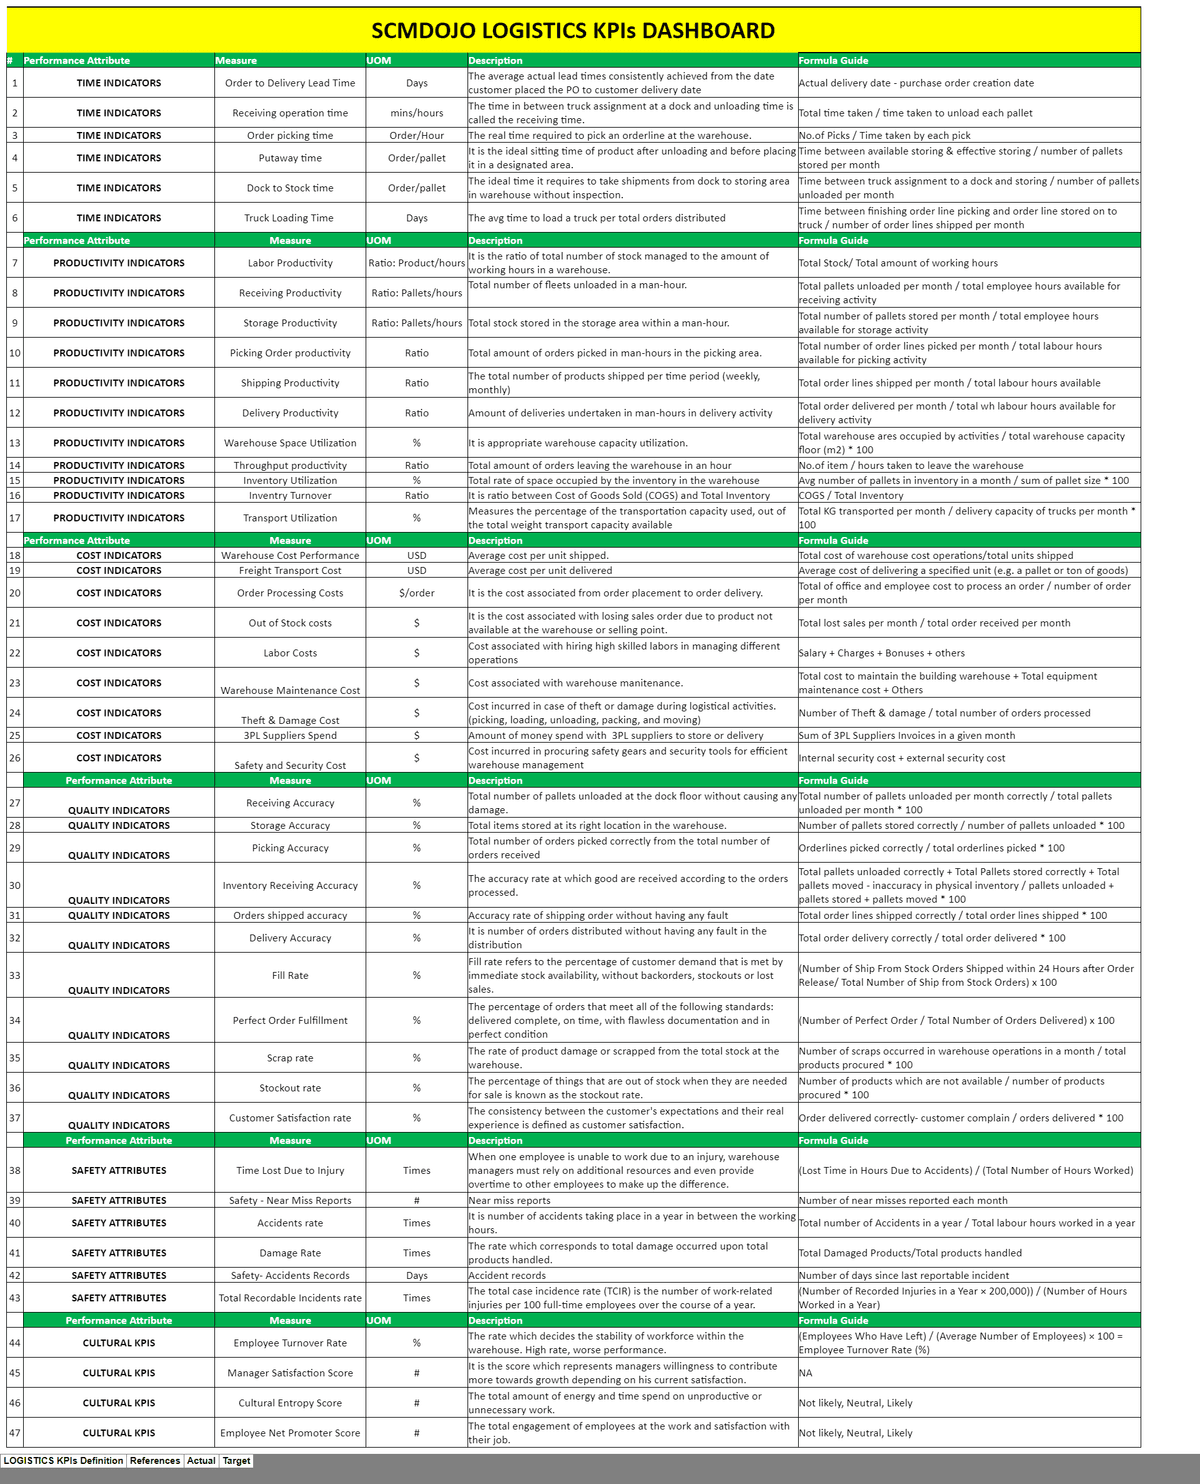
25+ Pre-Loaded KPI Definitions
A companion reference sheet with clear definitions for every KPI in the dashboard. Align your team on what each metric means and how it is calculated.
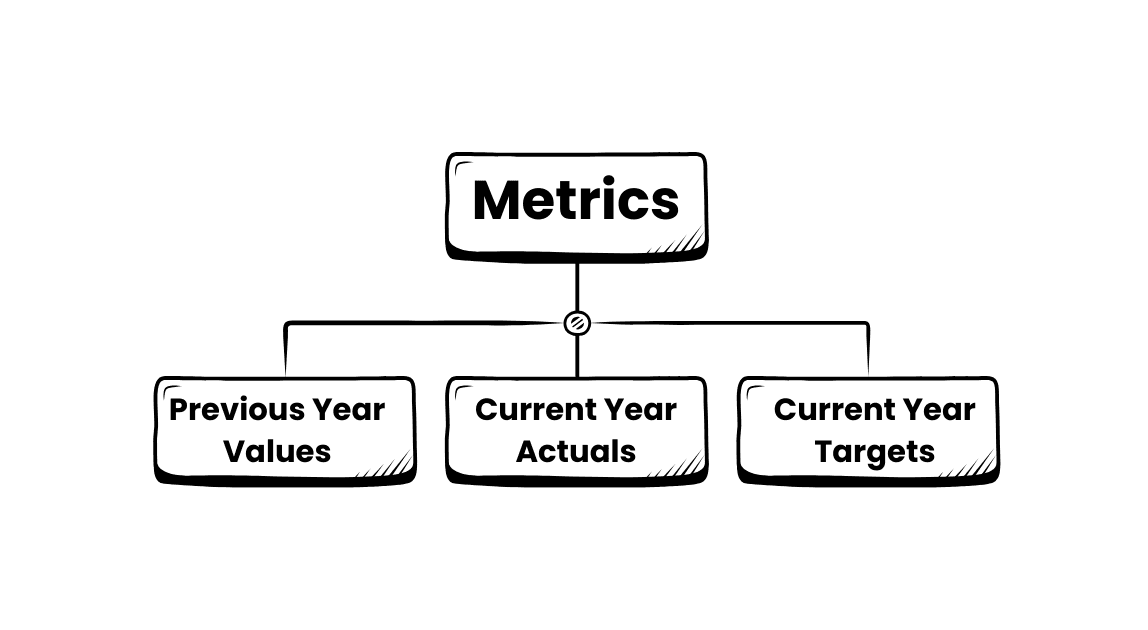
Performance vs. Target Comparison
Every KPI is shown alongside its target and prior period result. See at a glance where you are ahead, on track, or falling behind.
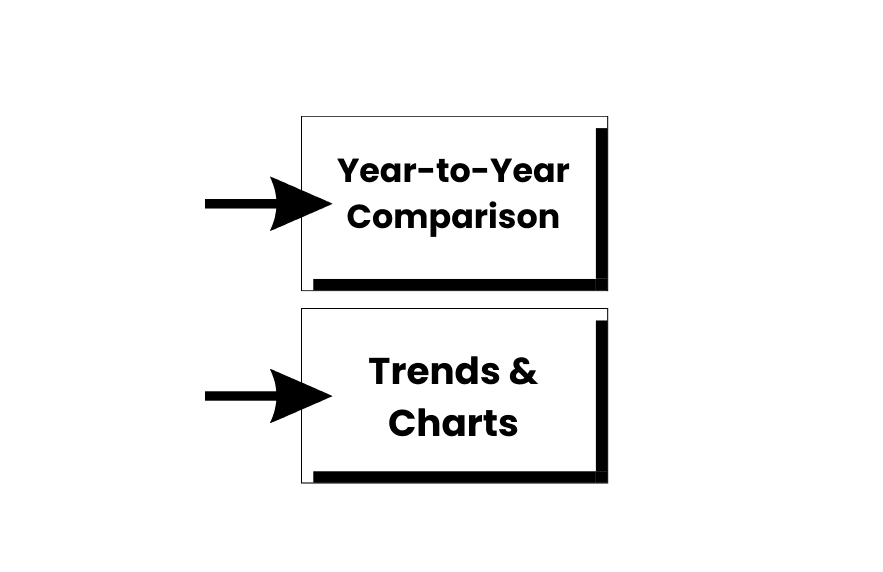
Trend Identification View
Spot patterns across periods, rising costs, declining accuracy, improving delivery times. Plan strategically rather than react to each month in isolation.
Fully Customisable Structure
Add your company name, logo, and custom KPIs. Adjust metric labels to match your operation's terminology. The template is fully unlocked and editable.
Performance visuals for every KPI your logistics team tracks
A visual logistics KPI dashboard makes it instantly clear where your operation is on track and where it needs attention, no digging through raw data required.


See the Logistics KPI Dashboard in action, under 10 minutes
Watch Dr. Muddassir Ahmed walk through the dashboard setup, data input, and how to read each of the six KPI focus areas, from time and cost through to safety and culture.
See what you'll be working with
Ten screenshots from the actual template, the input sheet, output summary, and individual KPI dashboards exactly as they appear when you open the file.


Designed for logistics and supply chain managers.
Not data scientists.
Ready to use immediately
No complex setup. Open the file, enter your data in the Input sheet, and every KPI dashboard populates. Your team is up and running in under an hour.
Saves 6–8 days per cycle
Stop rebuilding your KPI reports from scratch every month or quarter. This template is your permanent reporting foundation, update it, present it, repeat.
Six-dimensional KPI coverage
Time, cost, quality, productivity, safety, and culture, each with its own dedicated dashboard. No other free template covers all six in one workbook.
Target vs. actual comparison
Every KPI is displayed alongside its set target and historical result. Your team sees instantly where performance is on track and where it needs attention.
Trend analysis built in
Spot rising costs, declining accuracy, or improving delivery rates across periods. Plan your operations around data patterns, not monthly surprises.
Fully customisable
Add your logo, rename KPIs to match your organisation's language, and add new metrics. The template is fully unlocked, it adapts to your operation, not the other way around.
From raw operational data to leadership-ready KPI report in four steps
Enter your data
Fill in the structured Input sheet with your period's operational data across each KPI area.
Set your targets
Enter your KPI targets for the period. The dashboard calculates actual vs. target gaps automatically.
Review the output
Check the Output summary and each of the six KPI dashboards. Spot gaps and trends immediately.
Present & act
Take the dashboards straight into your ops review or leadership meeting. No reformatting required.
Built for the people who have to
present logistics performance to leadership
Run your ops review with real KPI data, not gut feel
Stop pulling numbers from three different systems. One template, all six dimensions, ready for your weekly meeting.
Walk into the board with a complete logistics performance picture
One dashboard covers cost, delivery, quality, safety, and people KPIs. No gaps, no scrambling before the meeting.
Replace the monthly rebuild with a repeatable reporting process
Update the Input sheet each cycle, and every dashboard refreshes. Spend your time on analysis, not formatting.
Deliver a logistics KPI baseline for a new client in hours
Load the client's data and produce a structured six-dimension KPI review on day one of the engagement.
Every logistics KPI question people ask,
answered by your own data
Logistics and supply chain managers searching for a KPI dashboard, or asking AI tools, want practical answers to these exact questions. This template gives you the structured output to answer all of them, with your own data, in seconds.
The six dimensions that matter most are time, cost, quality, productivity, safety, and culture. This dashboard pre-loads 25+ KPIs across all six so nothing critical gets missed.
Start with an Input sheet, calculate KPIs in an Output layer, then build individual charts per dimension. Or skip all of that, this template is already built and ready to populate.
KPIs make bottlenecks visible. When you can see that picking accuracy is declining or near-miss events are rising, you act before the problem compounds into a customer or safety incident.
BI tools need IT, budget, and weeks of setup. This Excel logistics KPI dashboard is ready today, works without any system integration, and costs a fraction of the price.
Leadership cares about on-time delivery, cost as a percentage of revenue, and safety. This dashboard surfaces all three in presentation-ready charts alongside the supporting operational detail.
With this template, under an hour. Open the file, enter your data in the Input sheet, and all six KPI dashboards populate immediately, no configuration needed.
Built by a practitioner who has lived
the KPI reporting problem firsthand
Before you buy
What KPIs are included in this logistics dashboard?
25+ pre-loaded KPIs across six areas: time, cost, quality, productivity, safety, and culture. A companion definitions sheet explains each metric clearly.
Do I need to know Excel well to use this?
No advanced Excel skills needed. Fill in the Input sheet and the dashboards update automatically. The video walkthrough covers everything in under 10 minutes.
Can I add my own KPIs to the template?
Yes. The template is fully unlocked and editable. Add, rename, or remove KPIs to match your operation's specific metrics and reporting language.
Is this suitable for both warehouse and transport operations?
Yes. The KPI framework covers both inbound and outbound logistics. The customisable structure lets you focus on whichever areas are most relevant to your operation.
What file format will I receive?
An instant download link to two files: the Excel dashboard (.xlsx) and the KPI Definitions PDF. Works on Excel 2016 or later, Windows and Mac.
How is this different from a generic KPI spreadsheet template?
Generic templates track one or two KPI dimensions. This one covers all six logistics dimensions in a single workbook, with target comparisons, trend charts, and a definitions reference sheet.
Do you offer team or enterprise licensing?
Yes. For team deployment or enterprise licensing, contact us at [email protected] and we will arrange a suitable package.

See exactly how your logistics operation is actually performing.
Download the SCMDOJO Logistics KPI Dashboard and turn your operational data into clear, structured decisions, starting today.
Instant download · Excel (.xlsx) · Lifetime access · No subscription
