The Production Scheduling Tool Built the Way Manufacturing Planners Actually Work
Stop rebuilding your production schedule every week in a spreadsheet that breaks. This Excel-based tool gives you Gantt chart visualisation, capacity analysis, work order load calculation, and push scheduling logic, all from your own demand, routing, and work centre data.
Instant download · Excel (.xlsx) · Works with any ERP export · Lifetime access
Your production data is sitting there.
The plan isn't.
From demand data to a feasible schedule, without the weekly rebuild
Every manufacturing team has the same problem. Demand comes in, work orders get raised, and someone, usually a planner, spends hours reconciling capacity, chasing bottlenecks, and trying to present a schedule that will actually hold. The data exists. A structured tool to turn it into a visual, capacity-aware plan usually doesn't.
A good production scheduling tool does three things well: it shows you load versus capacity at each work centre, it flags where you'll miss dates before you miss them, and it produces a Gantt view your operations team can actually act on. That's the difference between a schedule and a wish list.
This tool was built by Kien Leong, a practitioner with hands-on manufacturing and supply chain experience, to give planners the structured framework they need without requiring a £50,000 APS system or a month of configuration.
Are our work centres loaded correctly?
Load calculation from demand and routing data, automatic, not manual.
Where are the bottlenecks?
Capacity charts highlight constrained work centres and spare capacity side by side.
Will we hit the due dates?
Push scheduling logic adjusts dynamically for real-world capacity constraints.
What if demand changes?
Swap data sets to model alternative scenarios without rebuilding the whole file.
Every scheduling view your production team needs, pre-built
Populate the input tables with your demand, routing, and work centre data, and the tool calculates load, generates your Gantt chart, and surfaces capacity issues automatically.
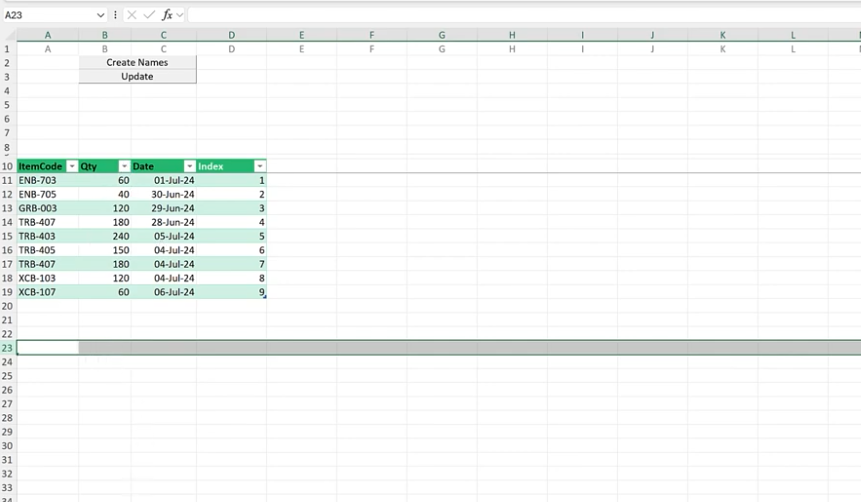
Demand Input Table
Import your demand data via a clean, user-friendly input table. No complex mapping required, structured for immediate use.
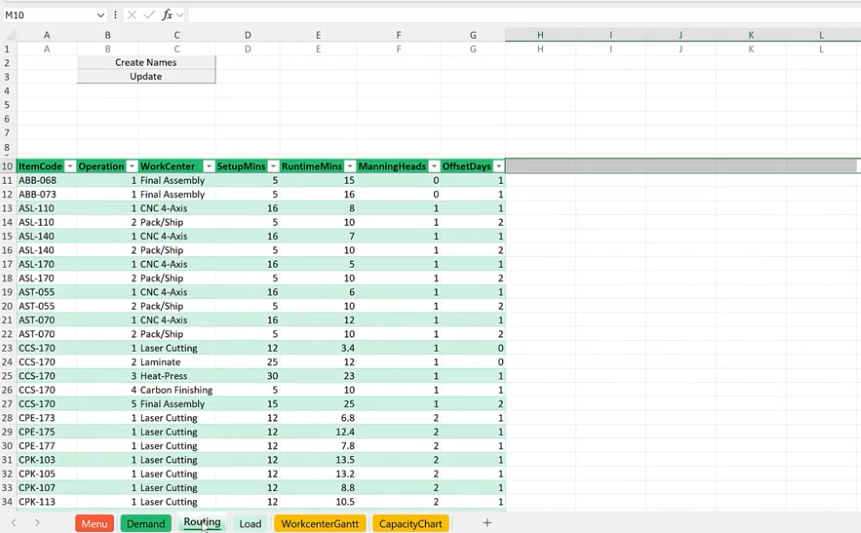
Routing & Work Centre Data Input
Load your routing sequences and work centre parameters. The tool uses these to calculate work order loads automatically.
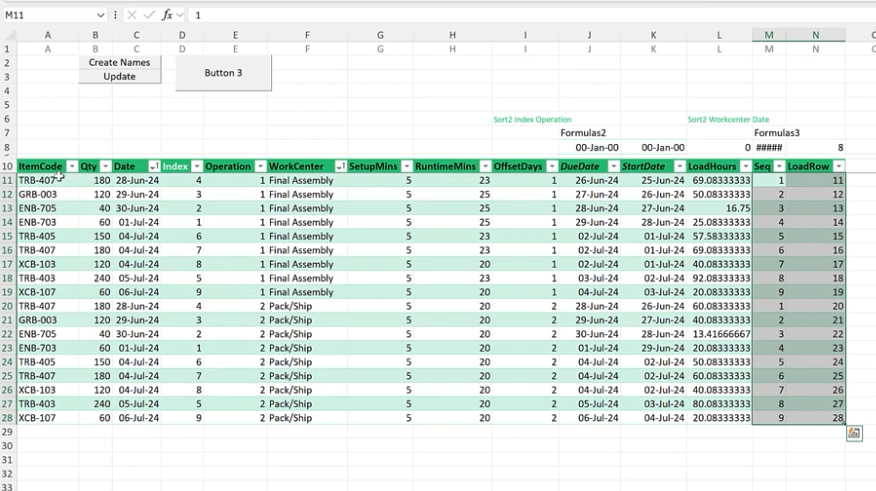
Automatic Work Order Load Calculation
Load per work centre is calculated automatically from your demand and routing inputs. No manual formulas to build or maintain.
Gantt Chart Visualisation
See the progression of tasks across all work centres in a clear Gantt view. Instantly usable for production meetings and daily stand-ups.
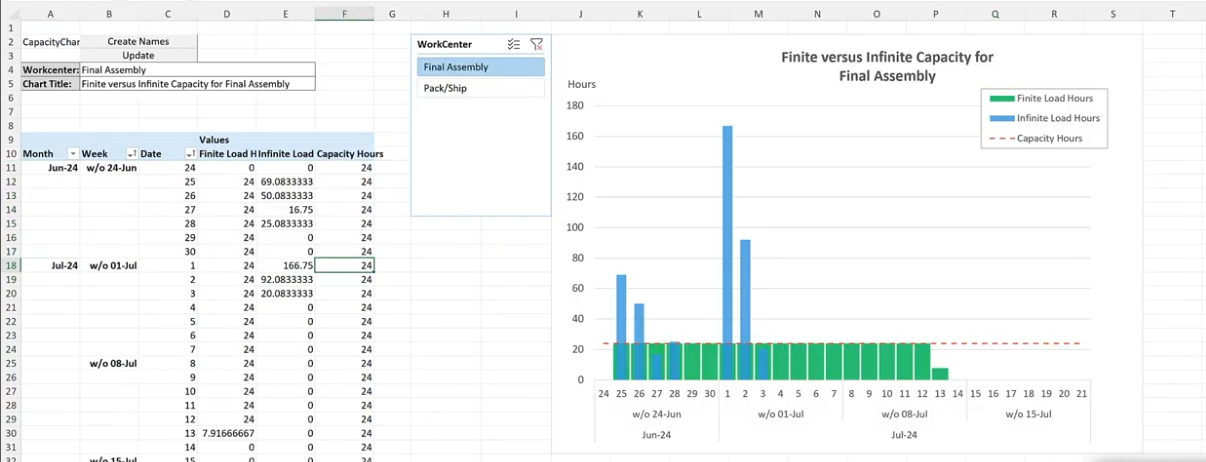
Finite vs. Infinite Capacity Analysis
Side-by-side charts compare finite and infinite capacity planning, highlighting bottlenecks and available headroom at each work centre.
Push Scheduling Logic
Schedules adjust dynamically when capacity constraints are applied. See the impact of real-world limits on your production timeline immediately.
Scenario Switching
Swap data sets to model different production scenarios without rebuilding the file. Test demand changes or routing alternatives in minutes.
Detailed Production Reports
Auto-generated reports from your production data give operations managers the insight to make decisions, not just compile numbers.
Step-by-Step Setup Guide
Clear instructions covering data preparation, input mapping, and how to read each output view. Any planner on your team can get started on day one.
Every scheduling view your team needs, in one workbook
A visual production scheduling tool removes guesswork from capacity planning and gives your team a plan they can actually execute.

See the Production Scheduling Tool in action, under 10 minutes
Watch Kien Leong walk through loading your demand and routing data, navigating the Gantt chart, and reading the capacity analysis outputs to spot bottlenecks before they hit the shop floor.
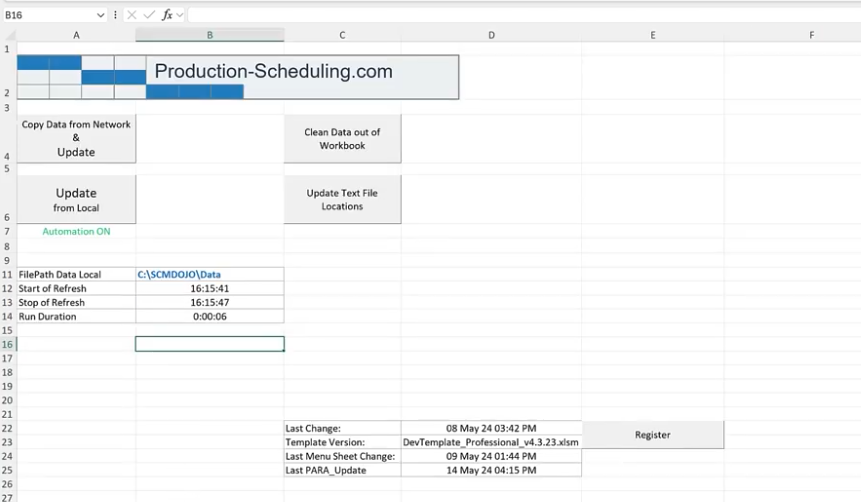
See what you'll be working with
A single, structured Excel workbook that takes your production data from raw input to a schedulable, capacity-aware plan.

Designed for production planners.
Not software engineers.
Customisable data inputs
Import demand, routing, and work centre data through structured input tables. No complex setup, works with any system that exports to CSV or Excel.
Automatic load calculation
Work order loads calculated automatically from your demand and routing data. No manual formula writing, the tool does the heavy lifting.
Gantt chart visualisation
Clear task-level Gantt view across all work centres. Presentable in production meetings, operations reviews, and S&OP sessions without any reformatting.
Bottleneck identification
Capacity charts surface overloaded and underutilised work centres side by side. Spot the constraint before it delays the order, not after.
Push scheduling with constraints
Adjust schedules dynamically when real-world capacity limits apply. See which orders get pushed and by how much, with no manual recalculation.
Scalable scenario switching
Swap entire data sets to model different production scenarios. Useful for demand changes, new product introductions, or capacity expansion planning.
From raw production data to a working schedule in four steps
Download the tool
Instant download after purchase. Open the Excel file in Microsoft Excel 2010 or later.
Populate your data
Enter your demand, routing, and work centre data into the input tables. Follow the setup guide included in your download.
Review capacity outputs
Load calculations, Gantt chart, and capacity charts update automatically. Identify bottlenecks and adjust as needed.
Present & act
Take the Gantt chart and capacity view into your production meeting. Your schedule is ready to communicate and execute.
Built for the people who have to
defend the production plan to operations leadership
Replace the weekly manual rebuild with a structured scheduling tool
Stop rebuilding the schedule from scratch each week. Load your data and get a capacity-aware plan in minutes.
Walk into the daily stand-up with a Gantt chart, not a gut feel
See which work centres are overloaded and which orders are at risk, before they miss the due date.
Model the production impact of a demand change before committing
Swap data sets to run scenarios. Show the capacity consequences of a demand spike before the sales team confirms the order.
Get APS-style scheduling without the APS price tag
This production scheduling tool gives you structured capacity planning in Excel, no software licence, no IT project.
Every production scheduling question planners ask,
answered by your own data
Practitioners searching for a production scheduling tool want practical answers to these exact problems. This template gives you the structured outputs to answer all of them, with your own data, without rebuilding a spreadsheet from scratch.
Production scheduling determines when and where each work order runs. Without it, you get missed due dates, overloaded work centres, and reactive firefighting instead of planned throughput.
Use structured input tables for demand and routing, not free-form data. Pre-built load calculation formulas and a Gantt output, like this tool, prevent the common breakage points.
Infinite capacity ignores real constraints; finite capacity respects them. This tool shows both views side by side so you can see the gap and make an informed scheduling decision.
APS systems are powerful but expensive and slow to implement. For teams that need structured scheduling today without a six-figure software project, an Excel tool is still the fastest, most practical option.
Yes. Identifying bottlenecks before orders are released, and adjusting the schedule proactively, removes the queuing time that inflates lead times in most plants.
Most planners are producing outputs within a few hours of download. The setup guide covers data preparation, input mapping, and how to read each output view.
Built by a practitioner who has lived
the production planning problem firsthand
Before you buy
What software do I need to run this production scheduling tool?
Microsoft Excel 2010 or later (Windows or Mac). No add-ins, no macros requiring special permissions, no additional software.
Do I need any coding or advanced Excel skills?
No. The tool is designed for planners, not developers. The included setup guide walks you through every step from data input to reading the outputs.
Can I import data from my ERP or MRP system?
Yes. If your system exports to Excel or CSV, you can load the data into the input tables. The tool is system-agnostic.
Will this work for my specific manufacturing industry?
The tool works for any manufacturing operation with demand, routing, and work centre data. It is fully customisable to your product structure and work centre names.
Can I use the tool for multiple production scenarios?
Yes. Swap data sets to model different demand levels, routing changes, or capacity scenarios without rebuilding the workbook each time.
What format will I receive after purchase?
An instant download link to the .xlsx Excel file, also sent to your email. Compatible with Excel 2010 or later and Microsoft 365.


See where your production plan is actually breaking down.
Download the SCMDOJO Production Scheduling Tool and turn your demand and routing data into a capacity-aware, presentation-ready schedule, today.
Instant download · Excel (.xlsx) · Lifetime access · No subscription
