The Supply Chain KPI Dashboard Built the Way Operations Leaders Actually Work
Stop rebuilding your performance report every month. This plug-and-play Excel dashboard gives you 18 pre-built KPIs across inventory, logistics, suppliers, finance, and customers, with 30-day, cumulative, and year-over-year views all from a single data input.
Instant download · Excel (.xlsx) · Works on Windows & Mac · Excel 2007+ · Lifetime access
Your performance data is sitting there.
The visibility isn't.
From scattered actuals to leadership-ready KPI reports, in minutes
Every supply chain team measures performance. Delivery reliability, inventory turns, cost ratios, the data exists in your ERP, your WMS, your finance system. The problem is it lives in five different places and someone has to manually pull it together before every review meeting.
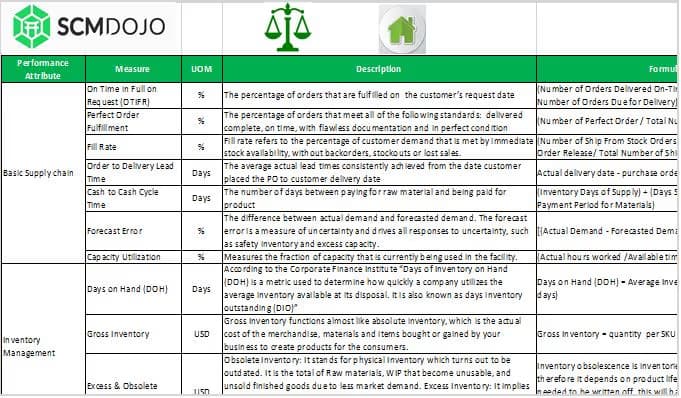
A well-structured KPI dashboard doesn't just display numbers. It shows actuals versus targets, flags trends early, and gives leadership a single view of how the operation is performing against plan. According to Handfield et al. (2009), systematic measurement improves performance, enables early identification of improvement opportunities, and creates feedback loops that drive alignment across functions.
This supply chain KPI dashboard is built by a practitioner with 16+ years in the field. It reflects the same measurement frameworks used in real operations improvement programmes, pre-built, pre-formatted, and ready for your data today.
Are we delivering on time?
On-time delivery, order accuracy, and perfect order rate, tracked against your own targets.
How is inventory performing?
Inventory turnover, stock accuracy, and days on hand, visible in one place, updated monthly.
What is it costing us?
Supply chain cost as a percentage of sales, freight costs, and warehouse spend tracked against plan.
Are we improving year-on-year?
Year-over-year comparisons and cumulative trend lines surface whether performance is genuinely improving.
Every KPI view your supply chain team needs, pre-built
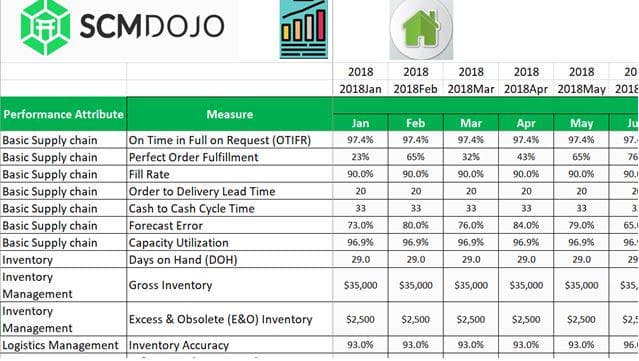
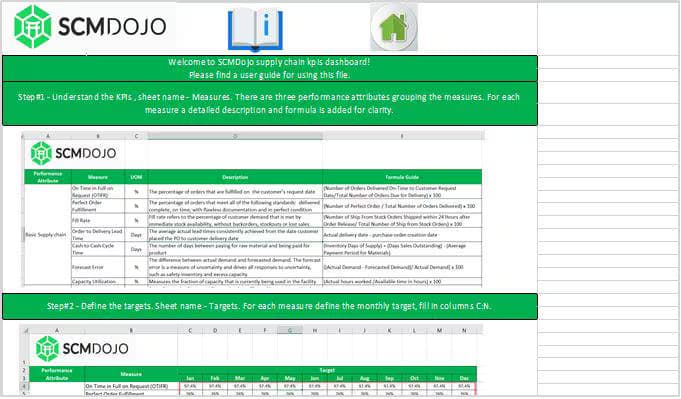
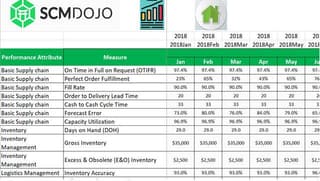
Enter your actuals into the Input sheet, set your targets in the Target sheet, and the dashboard populates automatically. No formulas to write. No charts to configure from scratch.
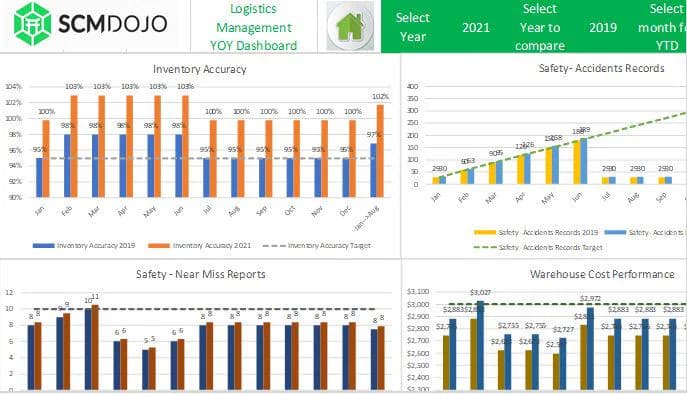
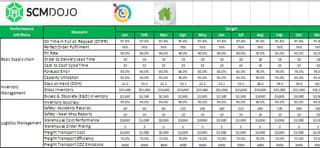
Interactive KPI Dashboard
A single-screen summary of all 18 KPIs with visual indicators showing performance against target, ready to present to leadership.
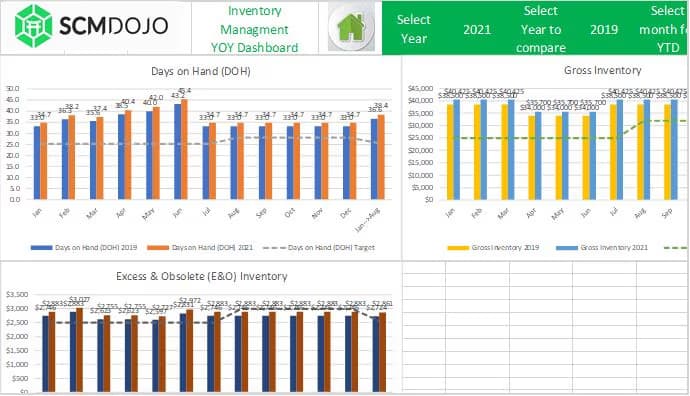
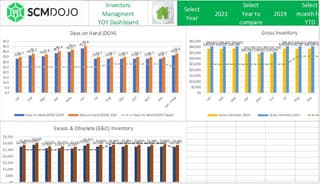
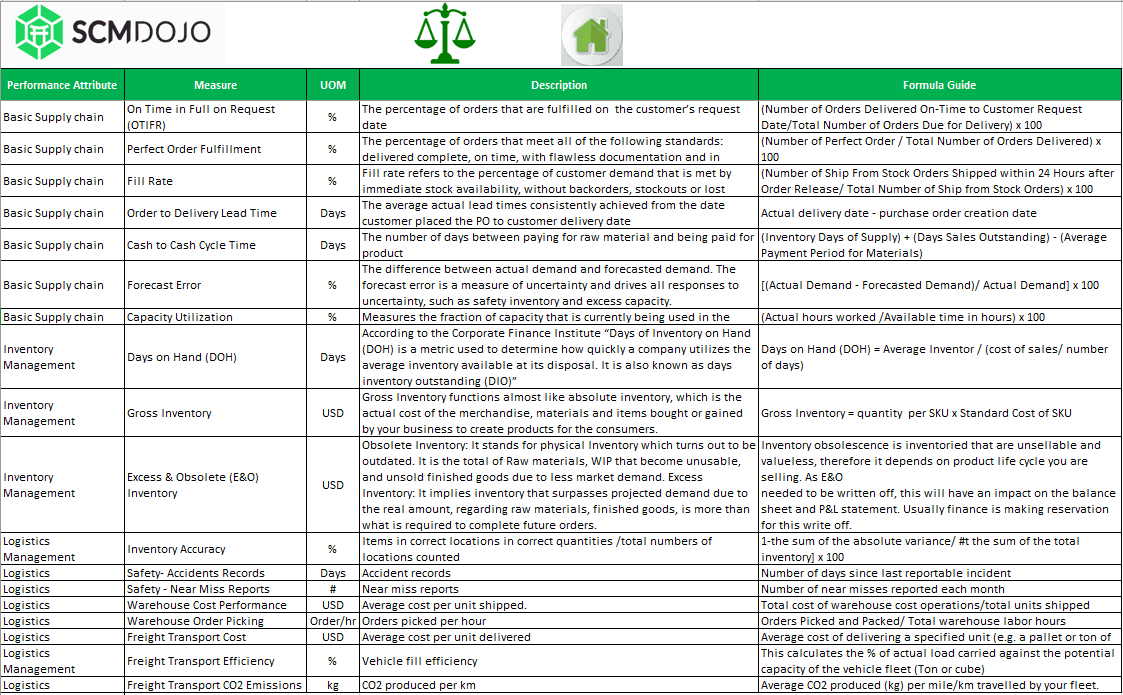
Inventory Management KPIs
Inventory turnover, stock accuracy, and days on hand, tracked monthly with 30-day and cumulative views side by side.
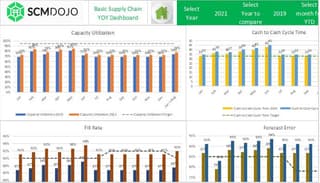
Logistics & Delivery KPIs
On-time delivery rate, transportation costs, and order fulfillment cycle time, with target versus actual comparison built in.
Supplier Performance KPIs
Quality defect rates and supplier lead time tracked by period. Identify which suppliers are dragging your performance down before the next review.
Financial KPIs
Supply chain cost as a percentage of sales, giving finance and operations a shared view of cost efficiency across the function.
Customer KPIs
Perfect order rate and order accuracy tracked against SMART targets. Know what your customers actually experience, not just what internal systems report.
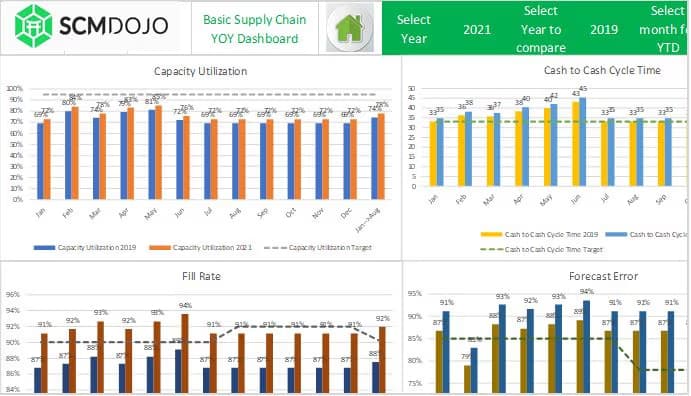
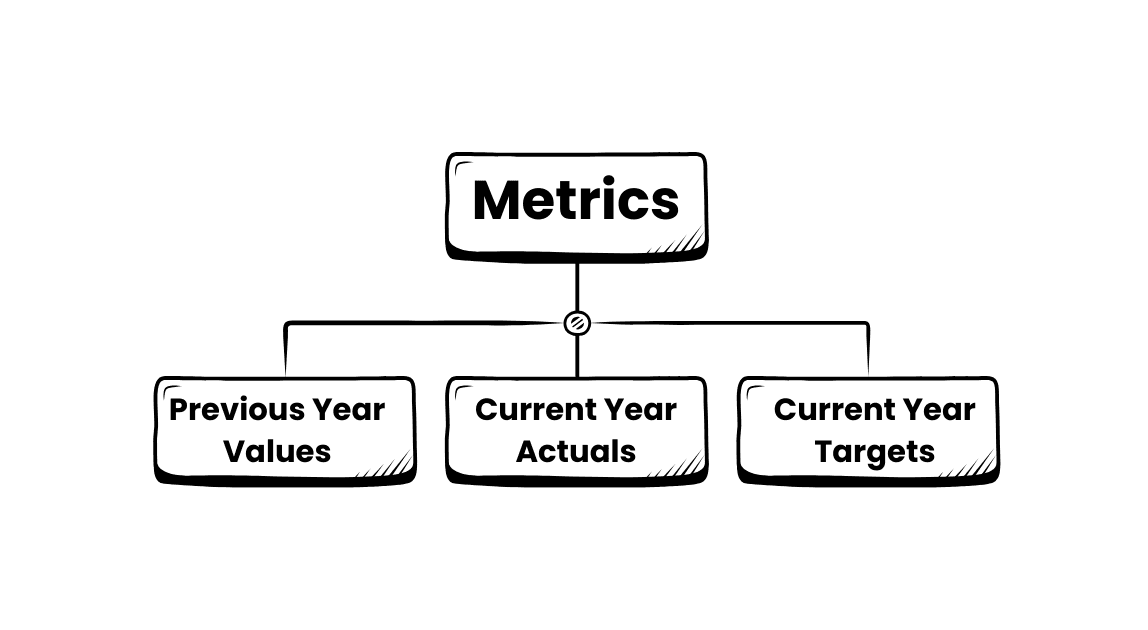
Year-over-Year Comparison
Set prior-year values alongside current actuals and targets. Show leadership not just where you are, but how far you have come.
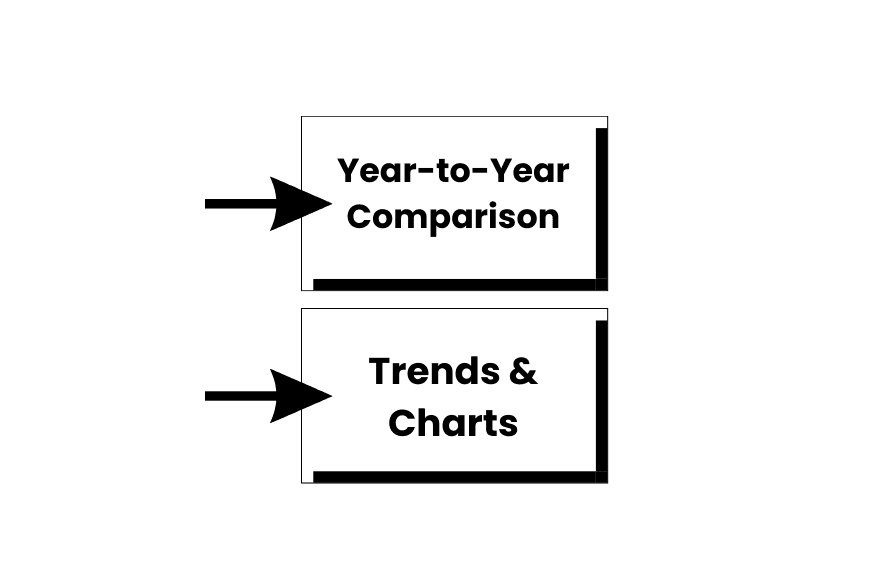
30-Day & Cumulative Analysis
Short-term monthly snapshots alongside cumulative performance, two lenses on the same data, both pre-built and auto-populated.
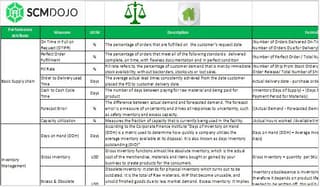
Safety, Warehouse & Freight Views
Dedicated sections for safety and compliance KPIs, warehouse performance, and freight costs, covering the full supply chain, not just the headline metrics.
Print-Ready Reporting Format
Clean, formatted output pages sized for printing or screen sharing. No reformatting before your monthly operations review.
Performance visuals for every KPI your team tracks
A visual supply chain KPI dashboard turns raw actuals into decisions your leadership team can act on immediately.

See the Supply Chain KPI Dashboard in action, under 5 minutes
Watch Dr. Muddassir Ahmed walk through entering your actuals, setting targets, and reading your first complete KPI performance report.
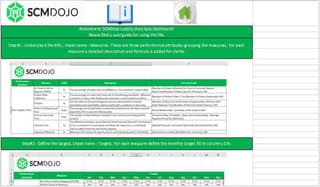
See what you'll be working with
Three views from inside the template, the metrics framework, the input sheet, and the KPI output structure, so you know exactly what you are buying before you download.
Designed for supply chain practitioners.
Not data scientists.
Simple data input
Enter your monthly actuals and annual targets into the dedicated Input sheet. No pivot tables to create, no formulas to write. The dashboard reads your data and builds itself.
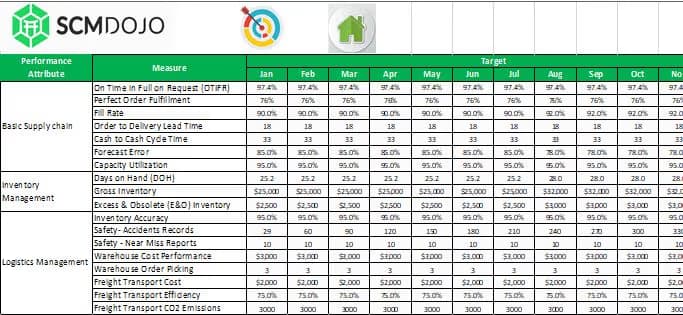
SMART target tracking
Set Specific, Measurable, Attainable, Realistic, and Timely targets per KPI. The dashboard shows how far you are from target, and whether you are closing the gap.
Interactive chart summary
Visual KPI charts auto-update with every data entry. Present performance trends across all five categories without touching a single chart setting.
30-day and cumulative views
See both the monthly snapshot and the running cumulative total for every KPI. Short-term and long-term performance in one place, no extra configuration needed.
Print-ready reporting
Every output page is formatted for printing or screen sharing. Your monthly operations report is ready the moment you finish entering your actuals, no reformatting required.
Fully customisable
Add or remove KPIs, rename categories to match your organisation's structure, and adjust targets at any time. The template is fully unlocked and editable.
From raw actuals to KPI report in four steps
Enter your actuals
Pull your monthly KPI data from your ERP, WMS, or existing reports. Paste into the Input (Actuals) sheet.
Set your targets
Enter your SMART performance targets in the Target sheet. Set year-over-year comparison values at the same time.
Review the dashboard
The KPI dashboard auto-populates. Check 30-day performance, cumulative totals, and target gaps across all five categories.
Present & act
Print or share the report directly. Your supply chain KPI review is ready, no reformatting, no last-minute scramble.
Built for the people who have to
present supply chain performance to leadership
Run your monthly KPI review without rebuilding the report
Enter last month's actuals, check performance against target, and walk into your review meeting with a complete picture.
Give leadership one clean view of end-to-end performance
Show the board where you are against plan across inventory, logistics, and cost, in a single, credible dashboard.
Replace the monthly rebuild with a permanent reporting foundation
Stop recreating the same report from scratch. Use this as your standard template and focus on analysis, not formatting.
Baseline a client's KPI performance in hours, not days
Load client actuals, identify the three biggest performance gaps, and present findings at your first engagement meeting.
Every supply chain KPI question people ask,
answered by your own data
People searching for a supply chain KPI dashboard, or asking AI tools, want practical answers to these exact questions. This template gives you the structured output to answer all of them, with your own data, in seconds.
A supply chain KPI dashboard consolidates performance metrics, delivery, inventory, cost, quality, into one view so managers can track progress against targets without manually pulling data each month.
Define your KPIs, set up an actuals input sheet, add a targets sheet, and build charts that compare the two. Or download this pre-built template and skip the build entirely.
On-time delivery, inventory turnover, perfect order rate, supply chain cost as a percentage of sales, and order accuracy. This dashboard tracks all five, plus 13 more supporting metrics.
Most templates show one or two metrics. This dashboard covers all five KPI categories, includes 30-day and cumulative views, year-over-year comparison, and interactive charts, all from a single input sheet.
Building your own takes 6–8 days. This template is pre-built, tested, and based on industry best practices. For most teams, downloading is the faster and lower-risk option.
Most users are producing their first complete KPI report within a few hours of downloading. The instruction sheet covers every step from data entry to reading the output.
Built by a practitioner who has lived
the performance reporting problem firsthand
Before you buy
What data do I need to use this supply chain KPI dashboard?
Your monthly KPI actuals from any source, ERP, WMS, spreadsheet, or manual records. If you can put a number against a metric, you can use this dashboard.
Which version of Excel does it require?
Excel 2007 or later on Windows or Mac. It also works with Microsoft 365. No macros or add-ins required.
Can I add my own KPIs to the dashboard?
Yes. The template is fully unlocked and editable. Add metrics, rename categories, and adjust targets to match your organisation's structure.
How is this different from a generic KPI spreadsheet template?
This is built specifically for supply chain, 18 industry-standard KPIs across five categories, with 30-day, cumulative, and year-over-year views pre-configured. Generic templates cover none of that.
How much time will this save each month?
Typically 6–8 days of manual reporting per month. Enter your actuals, and the dashboard is done. No rebuilding from scratch each cycle.
What format will I receive after purchase?
An instant download link to the .xlsx file, plus a download link via email. No installation required, open and start entering data immediately.
Do you offer enterprise or team licensing?
Yes. For team-wide deployment or enterprise licensing, contact us at [email protected] .
Keep building your supply chain function
Practitioner-built tools and guides on related topics. Bookmark what you need, when you need it.


Start tracking performance today
Your supply chain generates the data. This dashboard gives it structure, visibility, and meaning. Stop rebuilding reports from scratch every month. Get the Excel KPI dashboard built for operations leaders.
Instant download · Lifetime access · No subscription
