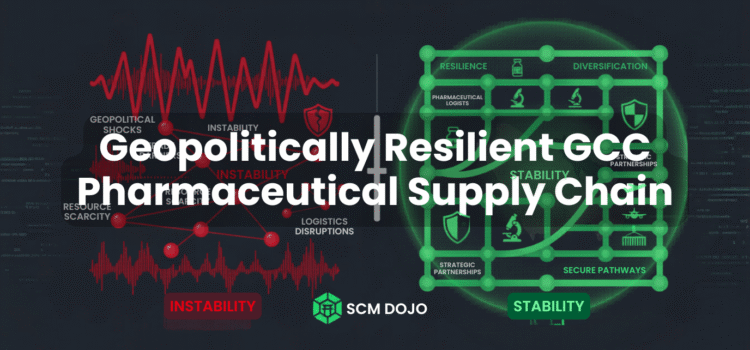
As geopolitical pressure reshapes global trade routes, supply chain leaders across the GCC are rethinking how to build a resilient pharmaceutical supply chain. This practitioner playbook draws on real frameworks, case studies, and data to help you act now. A practitioner playbook for supply chain leaders building a resilient pharmaceutical supply chain across the GCC region amid growing geopolitical risk.
The Red Sea crisis did not simply disrupt shipping lanes. It exposed every structural weakness hiding beneath the surface of GCC pharma logistics: regulatory complexity that compounds delays, distributors whose incentives are misaligned with supply reliability, cold chains that cannot survive port congestion in 48-degree summers, and safety stock strategies designed for a world that no longer exists.
This article draws on the frameworks, case studies and data from a comprehensive executive workshop on geopolitical resilience in GCC pharmaceutical supply chains. Whether you are a pharma manufacturer, a 3PL operating in the region, a public health authority, or a hospital supply chain leader, the ideas here are designed to be immediately actionable.
KEY INSIGHT The GCC pharmaceutical supply chain is no longer just a logistics problem. It is a geopolitical problem. And when medicines fail to reach hospitals in Riyadh, Dubai or Muscat, the consequences we measure success not in financial losses but in patient outcomes. |
CRITICAL CONTEXT Before the Red Sea disruptions, Europe-to-GCC ocean freight averaged 25 days. Post-crisis, that figure climbed to 40+ days. Maritime insurance premiums carrying political risk jumped from 0.5% to 2-3% of cargo value, a 400-600% increase. |
Need to get your team up to speed fast? SCM SENSEI – SCMDOJO’s AI supply chain consultant – provides 24/7 on-demand guidance grounded in structured supply chain knowledge. Start here to achieve resilience in the pharmaceutical supply chain.
Section 1: Geopolitical Risk Mapping in the GCC Pharmaceutical Supply Chain
Specifically, the GCC operates at the intersection of three major geopolitical fault lines: the Red Sea corridor (through which a substantial share of global pharmaceuticals transit), Iranian sanctions and airspace complexity, and intra-GCC political dynamics that periodically disrupt transit permissions and trade flows.
Furthermore, understanding these risks in country-specific terms is the starting point for any resilience strategy. Vulnerabilities differ sharply across the six GCC states. They are highly specific to local regulatory architecture, port infrastructure, and distributor market structure.
GCC country pharmaceutical supply chain vulnerabilities
| Country | Critical Vulnerability | Key Impact | Mitigation Priority |
| Saudi Arabia | Nupco monopoly; port dependency (Jeddah, Dammam) | Single channel concentration; inventory distortion | HIGH – Diversify distributor base |
| UAE | Port congestion (Jebel Ali, FZCO); Tatmeen registration delays | Lead time extension 14-21 days; regulatory hold-ups | HIGH – Expedite Tatmeen pre-registration |
| Oman | Limited port capacity; remote geography | Slow last-mile; stock-outs in interior regions | MEDIUM – Regional hub strategy |
| Qatar | Political isolation history; limited 3PL options | Supplier reluctance; premium logistics costs | MEDIUM – Long-term contracts |
| Bahrain and Kuwait | Dependent on Saudi and UAE transit | Demand volatility; transshipment risks | LOWER – Collaborative forecasting |
Regulatory Note: UAE’s Tatmeen System (MOHAP/EDE)
REGULATORY CLARIFICATION The UAE’s mandatory pharmaceutical track-and-trace platform is Tatmeen (Arabic for “assurance”). Enacted via Ministerial Decree No. 73 of 2021 and fully live from December 2022, Tatmeen is managed by MOHAP and now increasingly overseen by the Emirates Drug Establishment (EDE). It assigns every medicine a unique GS1-standard serialized code, enabling end-to-end traceability from manufacturing to dispensing. Compliance is mandatory for all local manufacturers, importers, distributors, hospitals and community pharmacies operating in the UAE. |
Saudi Arabia deserves particular attention. The Nupco structure, where a single government entity controls the bulk of hospital procurement, means that any demand signal distortion at that single node cascades catastrophically through the entire supply chain. During COVID-19, Nupco over-ordered by 400%, causing manufacturers to dramatically overproduce, only to face aged inventory write-offs months later.
The UAE presents a different structural challenge. Tatmeen registration delays, combined with Jebel Ali port congestion, routinely add 14-21 days to already-extended lead times. The summer heat amplifies every bottleneck: ambient temperatures of 45-50 degrees Celsius mean that even a brief delay in a non-temperature-controlled environment can destroy an entire pharmaceutical batch.
Section 2: The True Cost of Geopolitical Disruption
Supply chain professionals often frame geopolitical disruption as a logistics problem. The data tells a more complete story: it is simultaneously a cost problem, a service problem, and a compliance problem, and these three dimensions amplify each other.
+77% Ocean freight increase $3,500 to $6,200 per FCL | +140% Air freight cost increase $4-5 to $8-12 per kg (corrected) | +180% Safety stock days increase 20-25 days to 45-60 days |
+45% Cash-to-cash cycle deterioration Cumulative working capital impact | +600% Political risk insurance premium 0.5% to 2-3% of cargo value | +400% Customs holding time increase 3-5 days to 10-15 days |
PRE-CRISIS VS. POST-CRISIS COST COMPARISON: GCC PHARMACEUTICAL LOGISTICS
| Cost Component | Pre-Crisis | Post-Crisis | % Increase |
| Ocean Freight (FCL, 40ft) | $3,500 | $6,200 | +77% |
| Air Freight (per kg) | $4-5 | $8-12 | +100-140% |
| Temperature-Controlled Logistics | +15% premium | +35% premium | +133% (approx.) |
| Safety Stock (days inventory) | 20-25 days | 45-60 days | +120-140% |
| Port and Customs Holding (days) | 3-5 days | 10-15 days | +233-400% |
| Insurance (political risk) | 0.5% of value | 2-3% of value | +300-500% |
REALITY CHECK: HOW THE METRICS ALIGN WITH CURRENT EVENTS Ocean Freight and Insurance Spikes (+77% to +600%) • The Drivers: Maritime bottlenecks, including Red Sea disruptions and heightened tension around the Strait of Hormuz, have forced extensive rerouting. • The Reality: Container rates frequently spike past $6,000 during severe bottlenecks. DSV logistics tracking confirms war-risk and political risk insurance premiums regularly shoot from 0.5% up to 2-3% of total cargo value when shipping lanes enter high-alert conflict status. Air Freight Congestion (+100-140%) • The Drivers: Airspace closures and airport constraints across major Gulf hubs block standard corridors. • The Reality: Because pharmaceuticals (especially cold-chain biologics and oncology drugs) cannot safely endure prolonged sea rerouting, manufacturers are forced into mass modal shift toward air freight. According to Pharmaphorum’s market data, this demand surge coupled with restricted route availability has driven per-kilogram rates into the $8-12 range. Customs Holding and Safety Stock (+180% to +400%) • The Drivers: Constantly changing border rules, mandatory rerouting, and stricter regulatory compliance checks. • The Reality: Standard 3-5 day customs clearance timelines stretch past 10-15 days during acute crises. Pharma operations have actively transitioned away from Just-in-Time logistics, doubling safety stock buffers from 3 weeks to 45-60 days of strategic inventory. Working Capital Deterioration (+45%) • The Drivers: Slower transit times combined with high upfront freight outlays. • The Reality: When goods spend weeks longer in transit or sitting in customs, cash is trapped. This severely strains the Cash-to-Cash (C2C) cycle, requiring healthcare and pharma companies to inject significantly higher cumulative working capital to keep the pipeline moving. |
SCMDOJO RECOMMENDED RESOURCE Build your working capital resilience capability: Mastering Supply Chain Resilience |

Section 3: The Bullwhip Effect in GCC Pharma
Of all the supply chain pathologies that geopolitical disruption triggers, the bullwhip effect is the most destructive and the most misunderstood. What looks like a supply shortage at the manufacturer level often turns out to be demand distortion amplified by the panic behaviour of every actor in the supply chain.
THE BULLWHIP NUMBERS In a documented GCC case study, distributors over-ordered 250% during a period of geopolitical instability. The manufacturer ramped production accordingly. Six months later, actual demand had not changed. Aged inventory write-offs totalled $4 million. According to regional analysis from Baker McKenzie, when a geopolitical crisis naturally decelerates, the sudden demand collapse leaves distributors holding massive quantities of short-dated biologics or generic inventory. A $4 million write-off is a standard – and often conservative – loss figure for a mid-to-large regional drug portfolio hit by post-panic expiry. |
How the Bullwhip Effect Operates in Practice
To understand why this happens, consider how the mechanism operates in three simultaneous channels. Importantly, the mechanism operates in three simultaneous channels. Distributors, fearing supply scarcity, order 3x their normal volumes to secure supply. Retailers and hospitals, also fearing shortages, simultaneously double their orders from distributors. The manufacturer, seeing only the distorted order signal and no visibility of actual end-demand, overproduces. When tension eases and shelves are found fully stocked, orders collapse and the manufacturer is left with product approaching expiry.
BULLWHIP EFFECT: QUANTIFIED DEMAND DISTORTION IN GCC PHARMA
| Signal Source | Volume Signalled | vs. True Demand | Risk Created |
| True end-patient demand | 100 units/week | Baseline | None |
| Retailer/Hospital order | 250 units/week | +150% | False demand signal |
| Distributor order to principal | 300 units/week | +200% | Over-production trigger |
| Principal production | 350 units/week | +250% | Excess inventory risk |
| Hidden distributor inventory | 500 units | 5x weekly demand | Obsolescence risk + write-offs |
The solution is a structural redesign of how demand signals flow through the supply chain: moving from push (sales-target-driven) to pull (POS and hospital consumption signals), implementing Integrated Business Planning with full distributor and hospital visibility, and redesigning distributor incentives so they are rewarded for inventory health rather than order volume.
SCMDOJO RECOMMENDED RESOURCE Master demand forecasting and S&OP: SCMDOJO Demand Forecasting Methods Guide (40-page eBook) Covers forecasting techniques, MAPE improvement, and the full S&OP demand review cycle. |

SCMDOJO RECOMMENDED RESOURCE Run a world-class S&OP process: SCMDOJO Sales and Operations Planning Blueprint Course By Dr. Muddassir Ahmed – rated the definitive practitioner guide to S&OP. |

Section 4: Distributor Integration and Shared Visibility
Why Distributor Visibility Is the Missing Lever
In contrast to what most manufacturers assume, the single most powerful lever available is also the least used: treating the distributor as part of the supply chain rather than an external customer.
The single most powerful lever available to GCC pharma manufacturers is also the least used: treating the distributor as part of the supply chain rather than an external customer. The moment a manufacturer hands over a shipment to a distributor, most stop treating what happens next as their operational concern. That blind spot is where supply chain resilience dies.
If your organisation needs an always-available expert to navigate distributor integration, visibility strategy and S&OP design, SCM SENSEI AI – SCMDOJO’s AI supply chain consultant – can generate SOPs, run scenario analysis, and build action plans grounded in structured supply chain knowledge. Get access to Pro Plan here.
Three Pillars of Integration
DISTRIBUTOR INTEGRATION FRAMEWORK
| Pillar | Name | What It Means in Practice |
| Pillar 1 | Visibility and Transparency | Real-time stock positions at distributor, retailer and hospital levels. Daily data sharing via dashboards accessible to principal, distributor, 3PL and regulator. Removes information asymmetry and enables collective decision-making. |
| Pillar 2 | Aligned Incentives | Move distributor KPIs from volume pushed to service level, inventory turns and forecast accuracy. Shift commission: 70% based on sell-through, 30% on order volume. Joint S&OP reviews with transparent forecast sharing. |
| Pillar 3 | SOPs and Training | Defined processes for order placement, inventory management and exception handling. Cross-functional training for distributor staff. Critical in GCC where 70% of the workforce is expatriate and personnel changes are frequent. |
Four-Phase Implementation Roadmap
DISTRIBUTOR INTEGRATION ROADMAP: PHASES, ACTIONS AND OUTCOMES
| Phase | Timeline | Key Actions | Expected Outcome |
| Phase 1: Foundation | Weeks 1-4 | Define visibility requirements. Select data-sharing platform. Align on KPIs and SLAs. | Agreed metrics and platform baseline. |
| Phase 2: System Setup | Weeks 5-8 | Deploy inventory tracking. Integrate POS and order feeds. Train distributor staff. | Live data flowing into shared dashboard. |
| Phase 3: Execution | Weeks 9-16 | Run weekly S&OP with distributor. Monitor KPIs. Adjust incentives. Identify and resolve exceptions. | Demand distortion reduced. Bullwhip dampened. |
| Phase 4: Optimisation | Ongoing | Reduce safety stock. Improve forecast accuracy. Lower working capital. | Sustained resilience. Lower inventory. Higher service levels. |
GCC IMPLEMENTATION NOTE Many distributors in the region still operate on spreadsheets. Attempting full ERP or cloud platform integration as a first step will fail. The approach that works is to start with a simple shared KPI dashboard, earn trust, demonstrate value, and then progressively integrate deeper data feeds. Change management is not an afterthought here – it is the programme. |
Section 5: Resilient Pharmaceutical Supply Chain Last-Mile Distribution
Last-mile distribution in the GCC is where resilience plans most frequently fall apart. Port congestion, customs delays, trucking capacity shortages and the region’s extreme summer climate create a perfect storm of operational vulnerability precisely where supply chains are already at their most stretched.
Hub-and-Spoke Architecture with Regional Buffers
Recent industry developments from Argon & Co and updates from the Emirates Drug Establishment (EDE) confirm that shifting from a single centralised warehouse to a decentralised regional hub-and-spoke model is the standard playbook for preserving medical supply chain continuity.
REGIONAL BUFFER NETWORK: CONFIGURATION AND RATIONALE
| Node | Location | Buffer Target | Covers |
| Primary Hub | UAE / Saudi Arabia | Pass-through | Full GCC inbound |
| Regional Buffer 1 | UAE Mainland | 30-45 days high-risk SKUs | Abu Dhabi, Dubai, Ajman LDCs |
| Regional Buffer 2 | Saudi Eastern Province | 30-45 days high-risk SKUs | Riyadh, Jeddah, Dammam LDCs |
| Regional Buffer 3 | Oman Muscat | 30-45 days high-risk SKUs | Muscat LDC and inland facilities |
Last-Mile Performance Metrics
KEY PERFORMANCE INDICATORS: TARGETS AND MONITORING CADENCE
| Metric | Target | Monitoring Frequency |
| On-time delivery to hospital | 98% minimum | Weekly |
| Order-to-delivery lead time (normal) | 5-7 days | Weekly |
| Order-to-delivery lead time (crisis) | 10-12 days | Weekly |
| Temperature excursions | Zero tolerance | Real-time IoT alerts |
| Stock availability (hospital satisfaction) | 99% minimum | Weekly |
| Distribution cost per unit | 5-10% of product value (standard); higher during active crisis | Monthly |
| Inventory turn (regional buffers) | 6x per year minimum | Monthly |
DISTRIBUTION COST REALITY The distribution cost target is revised from the frequently cited ‘2% of product value’ benchmark. Standard pharma last-mile and secondary distribution costs range between 5-10% of product value under normal market conditions and should be expected to exceed this during any active geopolitical disruption. Plan for this rather than benchmark against a figure that reflects pre-crisis conditions. |
Section 6: Crisis Response Protocols
CRITICAL PRINCIPLE Having a resilience strategy that exists only in a presentation deck is not resilience. It is risk theatre. Operational preparedness requires pre-defined, sequenced response protocols that every stakeholder can execute without waiting for committee decisions. |
Protocol: Suez Canal or Red Sea Port Closure
DAY-BY-DAY CRISIS RESPONSE PLAYBOOK
| Day | Stage | Actions Required |
| D0 | Activation | Port closure confirmed. Activate alternative routing. Release pre-approved air freight budget (+$5-8 per kg). Notify all distributors: expect 21-day delay on in-transit ocean shipments. |
| D1 | Rerouting | Divert containers to alternate ports (Port Said, Saudi ports). Accelerate releases from UAE and Saudi buffer warehouses. Increase hospital delivery frequency from weekly to daily for critical SKUs. |
| D5 | Assessment | Monitor buffer depletion rates. Flag early stock depletion. Identify critical medicines (oncology, cardiac, antibiotics) at highest stockout risk. |
| D10 | Triage | Authorize expedited air freight for critical SKUs only. Activate pre-agreed partnerships with in-region manufacturers (Saudi, Egypt, Turkey). Maintain cost control for standard product lines. |
| D15-30 | Stabilisation | Gradually revert to ocean freight as ports normalise. Rebuild buffer warehouses. Debrief: adjust forecast models and increase safety stock parameters. |
Need to build these crisis protocols into your team’s SOPs? SCM SENSEI can generate ready-to-use crisis SOP documents, customised to your network configuration, in minutes. Get access to Pro Plan here.
Section 7: Three Case Studies That Define the Playbook
CASE STUDY 1 – SAUDI ARABIA The Nupco Monopoly: When Single-Channel Concentration Meets a Crisis | ||
| The Problem | Root Cause | Solution Applied |
| During COVID-19, Nupco over-ordered by 400%. Private hospitals simultaneously under-ordered. The manufacturer overproduced and faced aged inventory write-offs. Lead times extended from 35 to 60 days. | Complete visibility gap between the Nupco government channel, private hospitals and semi-government institutes. No integrated demand signal. Siloed decision-making with no collaborative S&OP structure. | Linked all three channels into integrated demand visibility. Weekly collaborative forecast review. Centralised safety stock buffer in Eastern Province released only on consumption signals. |
| RESULT: Lead time normalised to 42 days. Inventory turns improved 3x. Working capital freed by $2 million within 12 months. | ||
CASE STUDY 2 – UAE Jebel Ali | ||
| The Problem | Root Cause | Solution Applied |
| 18,000 units of temperature-sensitive antibiotic stuck at Jebel Ali for 8 days during 48-degree summer heat. Reefer container malfunctioned; temperature drifted to 12 degrees for 3 days. Batch failed stability testing. | $180,000 batch loss. 5-day hospital supply gap downstream. A three-way blame cycle between manufacturer, 3PL and port authority with no clear accountability or root cause resolution. | Two owned reefer trucks ($150K) for port-to-warehouse transit. IoT temperature sensors with real-time alerts at 1-degree excursion. 20-day pre-positioned buffer at inland warehouse away from port heat. |
| RESULT: Zero temperature failures in the following 18 months. Complete supply chain confidence restored among hospital customers. | ||
CASE STUDY 3 – GCC-WIDE Distributor Distortion and the $4 Million Inventory Write-Off | ||
| The Problem | Root Cause | Solution Applied |
| During 2022 geopolitical instability, distributors across UAE, Saudi and Oman over-ordered 250%. Company ramped production accordingly. Retailer and hospital demand was actually flat. Over-stock was invisible to the principal. | Distributor KPI was units sold. Incentive was commission on order quantity. Principal had zero visibility beyond distributor orders. No collaborative S&OP. Demand planning was completely blind beyond the first tier. | POS data integrated from retail pharmacies and hospital systems. Distributor KPI redesigned: service level, inventory turns, forecast accuracy. Commission restructured to 70% sell-through, 30% order volume. Weekly S&OP launched. |
| RESULT: Forecast MAPE improved from 42% to 18%. Inventory turns increased 4x. Working capital fully recovered within 12 months of implementation. | ||

Section 8: Stakeholder Collaboration and Commitments
Technical solutions without governance collapse under pressure. The single most important output of any supply chain resilience programme is a formal coalition of stakeholders with specific, measurable commitments.
STAKEHOLDER ROLES, CONCERNS AND COMMITMENTS IN CRISIS RESPONSE
| Stakeholder | Role in Crisis | Key Concern | Commitment Required |
| Public Health Authority (MOHAP/EDE) | Policy, regulation, emergency protocols | Medicine availability; patient access | 3-day turnaround on critical approvals during declared crises; share real-time hospital demand signals |
| Pharma Manufacturer | Supply, planning, contingency | Cost control; market access; compliance | Pre-position 30-day regional buffers; quarterly demand planning reviews with distributor and hospitals |
| Distributor | Last-mile, retail access, customer info | Margin preservation; survival | Daily inventory and order data via shared dashboard; weekly S&OP and crisis call participation |
| National Carrier (3PL) | Transportation, warehousing, logistics | Capacity utilisation; cost recovery | Guarantee 99% on-time delivery; invest in cold-chain infrastructure; maintain redundant routes |
| Healthcare Provider (Hospital/Clinic) | Demand, consumption, patient care | Medicine availability; shelf space; cost | Share POS and consumption data weekly; communicate demand changes within 48 hours |
| Customs and Port Authority | Border control, trade facilitation | Security; compliance; throughput | Fast-track critical medicines; establish pre-clearance programmes for registered pharma manufacturers |
Governance Structure: Standing Collaboration Forums
STANDING COLLABORATION FORUMS
| Forum | Frequency | Purpose and Attendees |
| Weekly S&OP Call | Weekly, 30 min, Tuesdays 8am GST | Demand forecast update, supply status, risk flagging, exception resolution. Attendees: MOHAP/EDE rep, manufacturer, distributor, 3PL, hospital reps. |
| Crisis Command Center | Daily during active crisis | Triggered by: port closure >3 days, Tatmeen/SFDA delay >7 days, carrier strike, border closure. Decision authority on routing changes, buffer releases, emergency procurement. |
| Shared Dashboard | Hourly (crisis) / Daily (normal) | Single pane of glass: regional inventory, in-transit orders, lead times, temperature data. Permission-based access for all coalition members. |
Together, these eight sections form a complete resilience blueprint. As a result, supply chain leaders who implement these frameworks will be far better positioned to absorb the next geopolitical shock.
Conclusion: Resilience Is a Choice, Not a Circumstance
Geopolitical risk in the GCC is not going to normalise. The Red Sea disruptions, Iranian sanctions dynamics, and intra-regional political complexity will remain features of the operating environment for the foreseeable future. The question is not whether the next disruption will happen. It is whether your supply chain will absorb it or collapse under it.
The frameworks in this playbook, from distributor integration and hub-and-spoke buffer networks to crisis response protocols and stakeholder commitment charters, are not theoretical constructs. They are the operational architecture of supply chains that kept medicines flowing when others ran out.
FINAL RECOMMENDATION Build the capability now, before the next geopolitical shock tests whether you have. Invest in shared visibility. Pre-position strategic buffers. Realign distributor incentives. Establish the governance coalitions. And measure everything against your agreed performance targets. |
Deepen Your Capability with SCMDOJO
RECOMMENDED RESOURCES FOR GCC PHARMA SUPPLY CHAIN LEADERS
| Resource | Relevant For |
| S&OP Blueprint Course | Distributor S&OP integration, collaborative forecasting |
| Inventory Planning and Control Course | Safety stock strategy, buffer sizing, stockout prevention |
| Demand Forecasting Methods eBook (40 pages) | Bullwhip dampening, MAPE improvement, demand sensing |
| Logistics Management Track | Last-mile distribution, cold chain, network design |
| SCM SENSEI – AI Supply Chain Consultant | 24/7 AI-powered supply chain guidance, SOP generation, crisis planning |
Frequently Asked Questions: (FAQs) Resilient Pharmaceutical Supply Chains in the GCC
How have recent geopolitical crises affected pharmaceutical supply chain costs in the GCC?
Geopolitical disruptions have drastically increased costs across the board. Ocean freight rates have spiked by 77 percent, air freight costs have more than doubled, and political risk insurance premiums have surged by up to 600 percent. Additionally, companies have been forced to increase safety stock from 20 days to up to 60 days to mitigate port and customs delays.
What is the Bullwhip Effect in the context of GCC pharma logistics?
The Bullwhip Effect occurs when temporary panic leads to massive demand distortion. Distributors and hospitals over order out of fear of shortages. Manufacturers see these inflated orders and overproduce. Once the crisis stabilizes, demand collapses and manufacturers are left with excess inventory and millions of dollars in expired product write offs.
Why is distributor visibility considered the missing lever in supply chain resilience?
Many manufacturers treat distributors simply as external customers. Once a shipment is handed over, visibility stops. By integrating distributors into the supply chain through shared KPI dashboards, real time point of sale data, and joint forecasting, manufacturers can dampen demand distortion and align incentives toward inventory health rather than just order volume.
What is the recommended last mile distribution model for the region?
Relying on a single centralized warehouse is no longer viable. Industry experts recommend a decentralized hub and spoke architecture. This involves a primary hub supported by regional buffer warehouses strategically located across the UAE, Saudi Arabia, and Oman, holding 30 to 45 days of high risk inventory to bypass local port congestion.
How does the UAE Tatmeen system impact pharmaceutical lead times?
Tatmeen is the UAE mandatory pharmaceutical track and trace platform designed to ensure end to end traceability. While crucial for compliance, the registration process combined with port congestion at Jebel Ali can routinely add 14 to 21 days to lead times, requiring supply chain leaders to build these regulatory delays into their planning and safety stock calculations.
About the Author – Dr. Muddassir Ahmed
Dr. Muddassir Ahmed is a globally recognized supply chain expert, thought leader, and keynote speaker. As the Founder & CEO of![]() SCMDOJO, he has built one of the world’s leading platforms dedicated to empowering supply chain professionals with cutting-edge knowledge, practical tools, and access to expert insights. With over 19 years of leadership experience spanning the UK, Europe, the Middle East, and Southeast Asia, Dr. Ahmed has held key roles at Bridgestone, Doncasters Group, Eaton, and Volvo Cars, managing multi-million-dollar supply chain operations.
SCMDOJO, he has built one of the world’s leading platforms dedicated to empowering supply chain professionals with cutting-edge knowledge, practical tools, and access to expert insights. With over 19 years of leadership experience spanning the UK, Europe, the Middle East, and Southeast Asia, Dr. Ahmed has held key roles at Bridgestone, Doncasters Group, Eaton, and Volvo Cars, managing multi-million-dollar supply chain operations.
His expertise spans all facets of supply chain management, with a particular focus on leveraging technology and innovation to optimize processes and build resilient supply chains.
Recognized among the Top 10 Supply Chain Influencers in the World by Supply Chain Digital, Dr. Ahmed has been instrumental in shaping industry best practices through his extensive research, vlogs, and thought leadership. Holding a PhD in Management Science from Lancaster University Management School, he is also a certified Six Sigma Black Belt.
His platform, SCMDOJO, serves a vibrant community with over 51,000 monthly visitors. Moreover, he has 72,000 newsletter subscribers, and a social media following exceeding 105,000 supply chain professionals
A sought-after keynote speaker and thought leader, sharing his insights on industry trends, best practices, and the future of supply chain management. Dr. Ahmed delivers high-impact talks on supply chain excellence, digital transformation, and strategic leadership. His mission is clear: to help supply chains thrive
You can follow him on LinkedIn, Facebook, Twitter