
Before we discuss safety stock formulas and calculations, we need to understand the use of safety stocks.
Definition of Safety Stock
“Safety stock is carried to protect against the possibility of a stock out.”
Safety stock protects against these…
- Customer Demand Variation, i.e., demand exceeds a sales forecast
- Supplier Delivery Variation, i.e., supply deliveries are later than planned lead times.
- Production Variation, i.e., production output is less than planned
In other words, it is the type of insurance policy that covers fluctuation in unpredicted and unforeseen events, whether sudden erratic demand, poor supplier delivery performance, or force majeure.
One of my bosses used to say.
Safety stock is necessary evil….however, it is a waste! Must regularly review safety stock to minimize.
However, reviewing safety stock is a time-consuming task, depending on the number of SKUs and what tools & software you are using. To make it easy for you, we have used our experience and developed an Inventory Optimization Tool that can do days’ work in hours.
What you can get from this Inventory Optimization Tool is:
- The total cost of goods sold
- Current inventory had
- Planned Safety stock value
- Inventory Turns
- Days on Hand
- The current on-hand inventory (in $ value and % of total) is grouped by the number of months of stock available.
- Inventory optimization proposals (A. Stock to stock with new safety stock levels; B. Stock to non-stock; C. Non-stock to non-stock; D. Non-stock to Stock with new SS levels)
- Current on-hand inventory profile in terms of (A. Usable inventory; B. Excess inventory; C. Obsolete Inventory)

And watch the complete step-by-step tutorial!
Using adequate safety stock formulas is also a must for any inventory planning methods you are using. Be it Kanban, MRP, Re-order Point, or so on.
Disadvantages of Safety Stocks
While talking about safety stock calculations here, we must consider the disadvantages of high-safety stocks!
- High-safety stock may cover the manufacturing problems of poor quality.
- It may also hide the supplier’s poor delivery performance
- High safety stock also hides inefficient production processes (long setup times, machine capacity issues, breakdown, etc.)
- It can also be a high skills shortage and inadequate manning
- In some cases, high safety stock hides transportation delays
Role of Safety Stock in Re-Order Point Calculations
A reorder point can be considered to be a level of inventory when a new order is positioned with suppliers to procure added inventory, equaling the economic order amount. The reorder point comes as a signal that notifies businesses on when to place an order. In calculating the reorder point, you would need knowledge on the lead time between receipt and ordering of merchandise. This process may be influenced by the monthly supply or total dollar ceilings of the held or ordered inventory.
Reorder point is the metric that tells organizations two essential things:
- The right time to order more materials from your supplier(s); and
- The right time to produce more products by creating a Manufacturing Order
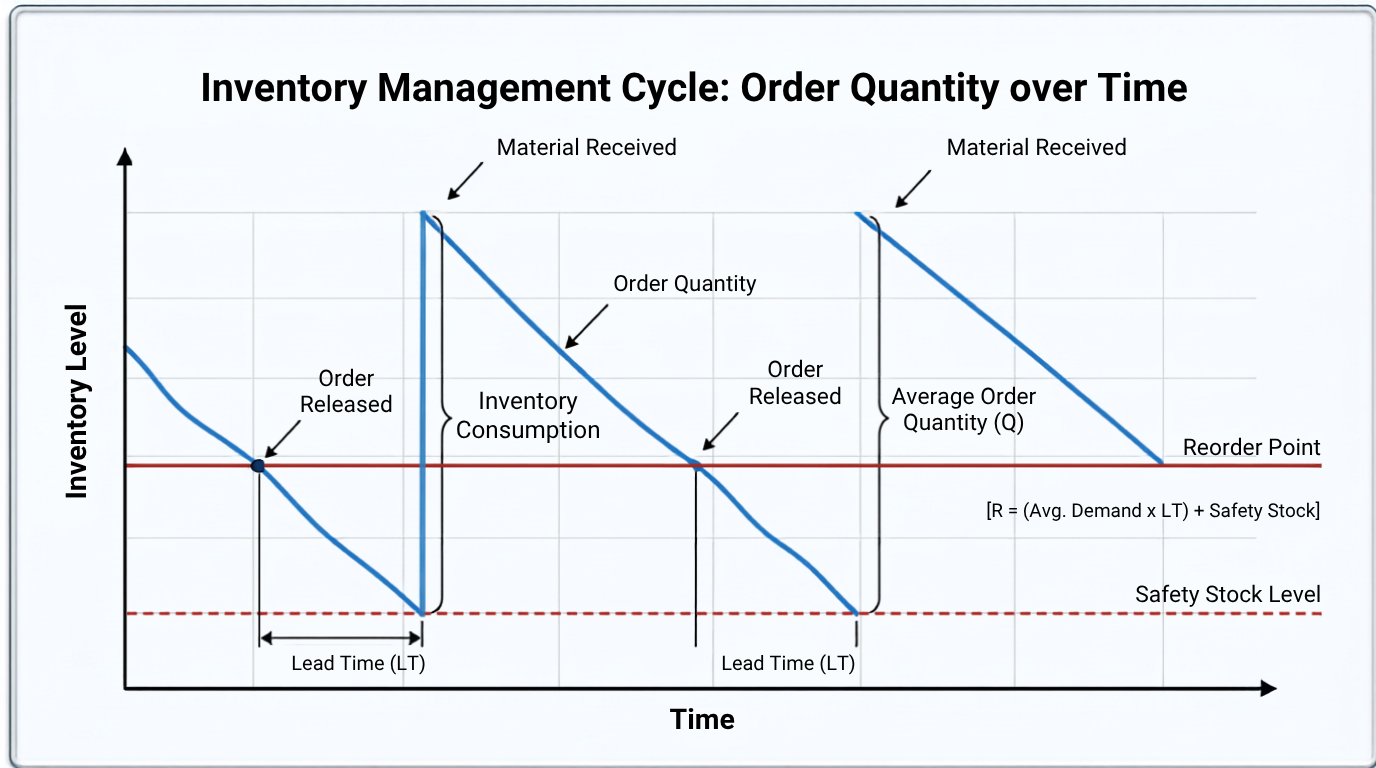
To calculate a reorder point with safety stock, multiply the average daily usage by the lead time and add the amount of safety stock you keep.
Re-Order Point = Average Daily Sales × Lead time + Safety Stock
To understand the Characteristics of Re-order Point Systems, you can access Inventory Planning Methods – The Ultimate Guide.

There are many ways in which safety stock calculations are done, and there are plenty of Safety Stock Formulas available that you could use. Below, we will go through 7 different definitions of safety stock formulas to get a comprehensive figure for safety stock. Ultimately, we’ve given you a ‘bonus track’ of EOQ calculation!
Statistical Safety Stock Calculation
Safety stock should represent the supply side variation (covers the supplier delivery variation) plus the customer or production variation. Statistics can be used to calculate x % fill rate given the supply source’s specific demand variation and lead time.
Safety Stock Formula: Supply side variation + (Std. Dev. * service level desired * square root of the replenishment lead time)
Safety Stock Example
Given:
Supply-side variation = 2 days
Std. Dev. = 300
Demand per week = 500 (100/ day)
Desired service level = 99% or 2.33 Std. Dev.
Lead time is 5 weeks.
Calculate Safety stock…
Solution:
Safety stock = 2 days (supply side variation) + (300 Std. Dev. * 2.33 desired service level * square root of 5)
Safety stock = 200 + 1563
Safety stock = 1763
Other Available Safety Stock Formulas:
1. Average SS
Safety stock = (max daily sale per unit * max LT in days) – (average daily sales per unit * average LT)
Although the above safety Stock formula is straightforward and gives an average amount of Safety Stock the company needs to hold per unit of stock, it does not take into account seasonal fluctuations (TradeGecko, 2010)
2. Heizer and Render (2013)
𝑆𝑎𝑓𝑒𝑡𝑦 𝑠𝑡𝑜𝑐𝑘 = 𝑍𝜎𝑑𝐿𝑇
Although this approach considers standard deviation, it does not account for time by including it as a variable in the equation (Emmanuel-Ebikake, 2015).
3. Greasley (2013)
𝑆𝑎𝑓𝑒𝑡𝑦 𝑠𝑡𝑜𝑐𝑘 = 𝑍 ∗( √𝐿𝑇) ∗ 𝜎𝑑
On the other hand, this approach takes lead time into account as a variable within the equation. This is one of my favorite Safety Stock formulas.
4. King method
𝑆𝑎𝑓𝑒𝑡𝑦 𝑠𝑡𝑜𝑐𝑘 = 𝑍 ∗( √ 𝑃𝐶 / 𝑇1) ∗ 𝜎𝐷
Z= Z-score (a statistical figure based on the cycle service level)
PC = performance cycle or total lead time (including transport time)
T1 = time increment used for calculating the standard deviation of demand
𝜎𝐷 = standard deviation of demand
King’s (2011) safety stock formula considers variations in demand, lead time, cycle time, and fill rate. The purpose of the formula was to overcome the inaccuracies in data on demand. (Emmanuel-Ebikake, 2015)
5. King (2011)
Safety stock = Z *√ ((PC/ T1 * σD 2) + (σLT × Davg)) 2
Z= Z-score (a statistical figure based on the cycle service level)
PC = performance cycle or total lead time (including transport time)
T1 = time increment used for calculating the standard deviation of demand
σD = standard deviation of demand
σLT = standard deviation of demand during the lead time
Davg= average demand
This safety stock formula is used when demand and lead time variability are independent and, therefore, influenced by different factors while still having a normal distribution.
But when demand and lead time are not independent of each other, this equation changes to:
Safety stock = (Z *√( PC/ T1 * σD) + ( Z * σLT * Davg)
6 McKinsey & Company Method
In selecting to consider any safety stock formula, it is essential to consider the joint impact of demand and replenishment cycle variability. This can be accomplished by gathering valid samples of data on recent sales volume replenishment cycles. Once the data are collected, it is possible to determine safety stock requirements using this safety stock formula:
σC = √R (σS2 ) + S2 (σR2 )
σC = Units of safety stock need to satisfy 68 percent of all probabilities (one standard deviation)
R = Average replenishment cycle
σR = Standard deviation of the replenishment cycle
S = Average daily sales
σS = Standard deviation of daily sales
Summary:
Like many other statistical theories and a mathematical equation, no safety stock formula can be claimed to be the best. Similarly, no formula can claim to be fit in all scenarios. Use your knowledge and experience to find which formula best suits your business.
If you happen to know and have se other safety stock formulas or calculations, please share them in the comments box with the supply chain community and me.
Recommended Content in Inventory Management:
Recommended Course:


Frequently Asked Questions (FAQ)
How do you calculate the safety stock?
To calculate safety stock, you typically follow these steps. First, determine the average demand during a specific period. Next, calculate the standard deviation of the demand, which measures the variability. Multiply the standard deviation by a chosen Z-score (representing a level of confidence, e.g., Z=1.96 for 95% confidence), and finally, multiply this result by the square root of the lead time. Add the product to the average demand to obtain the safety stock level, acting as a buffer against uncertainties in demand and lead time.
What is an example of a safety stock?
An example of safety stock is when a retailer anticipates an average weekly demand of 100 units for a particular product based on historical sales data; however, due to uncertainties such as unexpected spikes in customer demand or delays in supplier deliveries, they decide to maintain a safety stock of 20 units. This extra inventory acts as a buffer, ensuring that the retailer can meet customer demand even during unforeseen circumstances.
What is safety calculation?
Safety stock calculation involves assessing potential variations in demand and lead time to determine a buffer inventory level. It typically includes estimating average demand, calculating the standard deviation to measure variability, and factoring in a chosen confidence level (represented by a Z-score). When added to the average demand, the result provides a safe stock level that helps mitigate the impact of uncertainties in supply chain dynamics.
What is the minimum stock level?
The minimum stock level, also known as the reorder point, is the threshold at which the quantity of inventory triggers a reorder or replenishment process. It represents the minimum quantity of a product that should be on hand before new stock is ordered to prevent stockouts during the lead time required for procurement or production. The minimum stock level takes into account factors such as average demand, lead time, and safety stock to ensure that sufficient inventory is maintained to meet customer demand without disruptions.
References:
Heizer, J. and Render, B. (2014), Operations Management: sustainability and supply chain management, 11th ed. Pearson, England
Greasley, A. (2013). Operations Management, 3rd ed. Wiley, England
Slack, N.Brandon-Jones, A. Johnston, R. (2013) “Operations Management” 7th ed. Pearson, Harlow, UK
Robert Hammond of McKinsey and Company, Inc. as reported in Robert Fetter and Winston C. Dalleck Decision Models for Inventory Management (Burr Ridge, IL; Richard D, Irwin, 1961), pp. 105-8
Browne. J., Harhen. J. and Shivnan. J., (1996). Production Management Systems. 2nd edition. Addison Wesley. Harlow, England
DEBodt, M. and Van Wassenhove, L. 1983. “Lot sizes and safety stock in MRP,” Production and Inventory Management, 24(1)
About the Author- Dr Muddassir Ahmed
Dr. Muddassir Ahmed is a globally recognized supply chain expert, thought leader, and keynote speaker. As the Founder & CEO of![]() SCMDOJO, he has built one of the world’s leading platforms dedicated to empowering supply chain professionals with cutting-edge knowledge, practical tools, and access to expert insights. With over 19 years of leadership experience spanning the UK, Europe, the Middle East, and Southeast Asia, Dr. Ahmed has held key roles at Bridgestone, Doncasters Group, Eaton, and Volvo Cars, managing multi-million-dollar supply chain operations.
SCMDOJO, he has built one of the world’s leading platforms dedicated to empowering supply chain professionals with cutting-edge knowledge, practical tools, and access to expert insights. With over 19 years of leadership experience spanning the UK, Europe, the Middle East, and Southeast Asia, Dr. Ahmed has held key roles at Bridgestone, Doncasters Group, Eaton, and Volvo Cars, managing multi-million-dollar supply chain operations.
His expertise spans all facets of supply chain management, with a particular focus on leveraging technology and innovation to optimize processes and build resilient supply chains.
Recognized among the Top 10 Supply Chain Influencers in the World by Supply Chain Digital, Dr. Ahmed has been instrumental in shaping industry best practices through his extensive research, vlogs, and thought leadership. Holding a PhD in Management Science from Lancaster University Management School, he is also a certified Six Sigma Black Belt.
His platform, SCMDOJO, serves a vibrant community with over 51,000 monthly visitors. Moreover, he has 72,000 newsletter subscribers, and a social media following exceeding 105,000 supply chain professionals
A sought-after keynote speaker and thought leader, sharing his insights on industry trends, best practices, and the future of supply chain management. Dr. Ahmed delivers high-impact talks on supply chain excellence, digital transformation, and strategic leadership. His mission is clear: to help supply chains thrive
You can follow him on LinkedIn, Facebook, Twitter


How to Calculate Safety Stock for Optimal Inventory Levels - Falcon Fulfillment
[…] Heizer and Render’s Formula – this method is best if you have significantly varied lead times. […]