

Every business person understands that the essence of inventory in the running of a business is huge and should not be overlooked. The reason for this is that overlooking may lead to a number of challenges for a business. Such challenges vary from missed sales, high inventory carrying cost, warehouse space issues, poor customer delivery, and incremental costs to upset customers. All these challenges can be avoided by introducing appropriate inventory management KPIs.
If you use correct key performance indicators (KPIs), it is easy to effectively manage your stock to ensure good cash flow, measure the impact of your inventory reduction actions, tactics, and strategies, as well as profitability. You should use the right KPIs to quantify how effective your inventory management strategies are.
You may be wondering why you should utilize the right Inventory Management KPIs. With these Inventory Management KPIs, you can make the best choices and plans towards the successful running of your business tasks. It would make it easier for you to deliver satisfactorily, maintain strong consumer relationships, and reduce expenses.
When choosing the most suitable Inventory Management KPIs, you need to deliberately consider available alternatives. There are some interesting points before you settle on which inventory management KPIs will be increasingly pertinent to your business:
- Inventory management KPIs shape how you do your job or specific supply chain processes. Therefore, you should carefully make your choice.
- Resist choosing Inventory Management KPIs that are too broad in range. Being too broad may not help you to effectively use them to promptly deliver insights into the various aspects of your business that you need to handle properly.
- While it seems easy to choose Inventory Management KPIs that reflect efficiency, it is usually pretty difficult to select those that reflect increases in the level of effectiveness. However, you should go for the latter, which is more relevant to your business.[ See The Role Of Effectiveness & Efficiency in Supply Chain Optimization]
- Watch out for vain Inventory Management KPIs. These kinds of KPIs make a particular department or process appear good, yet they don’t provide any insights into how to ensure the effectiveness of inventory management, production processing, or the supply chain.
- Stock Inventory Management KPIs should reflect your company’s strategic goals and how those goals are being achieved.
- You should try to lessen or remove any kind of Inventory Management KPIs that creates competition among departments within your company. It is best to go for the ones that promote collaboration.
- For any inventory system you select, always ensure that you can configure the Inventory Management KPIs dashboard easily to suit your business needs.
To fully comprehend and a business activity is performing, you need to start measuring KPIs for such an activity. Regarding inventory management, there are a number of Inventory Management KPIs worth considering. Since every business is different in a way, you have to determine which KPI seems most appropriate to you and is most relevant to your business.
In this article, we will tell you the seven (7) rock-solid Inventory Management KPIs for successful inventory management.
Inventory Management KPIs Are:
1) Gross Inventory
Gross Inventory functions almost like absolute inventory, which is the actual cost of the merchandise, materials and items bought or gained by your business to create products for the consumers. Gross inventory means the cost of all stock decided on a first-in-first-out premise either under the retail or average cost technique. Simply put Gross Inventory Formula:
Gross Inventory = Number of units/quantity per SKU x Cost/Standard Cost of SKU
The best way to manage Gross inventory to learn and master all available Inventory Planning Methods.
To help supply chain community I have written a detailed Guide to Inventory Planning Methods. The objective of this guide is to describe the present use, application and characteristic of selecting various inventory planning methods, and to explain how the methods are applied by the supply chain professionals.
This guide would be considering five Inventory Planning Methods which includes:
- Kanban Kanban
- Run-out time
- Re-order points
- Fixed Order Interval
- Material Requirement Planning (MRP)
Most of the Inventory Planning methods can be used in manufacturing as well as in the distribution industry.
This Inventory Management KPI should be presented in a simple graph as shown below comparing Actual Gross Inventory vs Inventory Forecast vs Inventory Budget
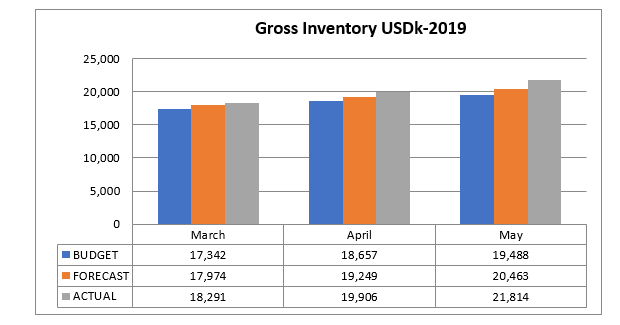
Previously, the average stock was simply the average of beginning and ending inventory. However, I would advise utilizing gross inventory rather than net inventory (considering the valuation allowance).
2) Net Inventory
Net inventory entails the total inventory without allowances for reserve inventory and assigned goods. That is, net inventory is what you have available on sales. For reserve inventory, this is an allowance made available for missing, outdated, and spoilt items, which have lost their value and cannot be sold. You can also exclude from net inventory the value of goods assigned to promotional events or allocated for certain customers.
In my time as a supply chain manager, I have not focused much on reporting net inventory as the difference is negligible in presenting Gross Inventory and Net Inventory
3) Days on Hand (DOH)
This KPI is essential for examining the number of times an inventory has been sold and substituted within a precise period.
According to the Corporate Finance Institute “Days of Inventory on Hand (DOH) is a metric used to determine how quickly a company utilizes the average inventory available at its disposal. It is also known as days inventory outstanding (DIO)” . In other words: Time required to convert inventory into sales. Generally: The lower the better, unless the ability to fill customer orders drops to an unacceptable level.
The Days on Hand KPI is calculated by taking the Cost of Good Sold (COGS) into account. It consists of the average stock, COGS, and number of days.
The Days of Inventory on Hand figure is computed by taking the COGS into account. More specifically, it consists of the average stock, COGS, and number of days. The formula is given as:
Days on Hand (DOH) = Average InventorY / (cost of sales/ number of days
DOH is calculated as outlined in the following example:
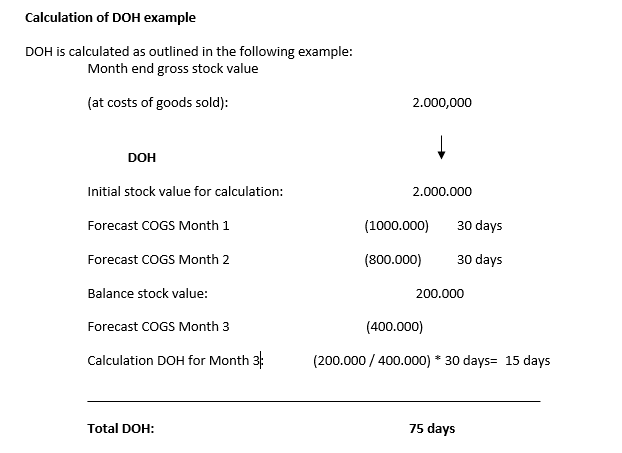
In my experience, Gross Inventory and DOH are the two most important metrics you should focus on for Inventory Management and Control. It does get difficult to have DOH as KPI for Raw Material or WIP or other subsets of inventory, so just focus on DOH as overall inventory number and KPI.
4) Inventory Turns (also known as turnover rate)
Inventory Turns, or Inventory turnover ratio, is used to measure the number of times items are sold and substituted over a precise period.
A good definition is written by Susan Randall in CIPS Knowledge Paper as
“This inventory turns ratio measures how many times a company’s inventory has been sold (turned over) during a period of time. The cost of goods sold divided by the average level of inventory on hand is the key metric. Operationally, inventory turns are measured as total throughput divided by the average level of inventory for a given period, often measured annually”
This is usually done on a yearly basis. There is a high turnover when the items are moving off the shelves as fast as possible, and the number of sales is high.
If inventory turnover is low, this can suggest that your business has excess inventory, and you should consider reducing the number of orders to lower the costs of carrying or appraising various items. If you want to assess inventory turnover, simply find the average number of days to sell. Doing this presents you with the length of time it takes to sell a product on average and the number of days’ worth of sales is present in the inventory.
When there is a low average-day-to-sell, this can be seen often as a positive sign but can lead to the issue of stock-outs, affecting the experience of customers. Also, higher average-days-to-sell can be seen as overstocking and wasted warehouse or shelf/storage space.
There is a formula, which is:
Inventory turnover = Cost of Goods Sold ÷ Average Inventory
5) Inventory Ageing
Also known as the Average Age of Inventory, this Inventory Management KPI is an important one. When I do Inventory Optimisation Modelling Inventory Aging is an important KPI to show, how much inventory has Reached of Stock (ROS) less than 3 months, and which are endless.
It represents how many days it took to sell an item. Usually, this is calculated by dividing the cost of inventory by the cost of the sold goods. This will then be multiplied by 365 for the yearly score. The older your inventory, the more the costs, and the more you can discover if your items are properly priced or not.
Remember that the Average Age of Inventory can differ widely across businesses or items. For example, Christmas decorations can still be sold in the following year, but it will still cost you to store it in your warehouse or storage space. Aging inventory can become a high cost for consumer electronics, which demand regular new versions and the need to stay updated with the trend. In retail, if the age of inventory is beyond 120 days, you have to think about lessening the price (markdown), adding it with other available products or selling it off at probably a low cost to distributors.
Below is the example of where Reach of Stock for more than 50% of the inventory is more than 18 months. This Inventory Management KPI drives the focus on those SKU and required special inventory reduction strategies.

6) Dead or Obsolete Inventory
Inventory obsolescence is inventoried that are unsellable and valueless. It is defined as inventory that has stretched past its useful life as a finished product.
In other words, if you hold an inventory for too long, it will more likely become outdated or damaged beyond any repair. In any case, the loss is often huge. Therefore, it is necessary for you to track the value of your outdated inventory. You can do this monthly or quarterly. The best way is to use deploy GUIDE TO EXCESS AND OBSOLETE INVENTORY POLICY which outline
This Excess and Obsolete Inventory Policy Guide helps you proactively identifying, accounting for and resolving the disposition of excess and obsolete inventory. Also to assign the proper accountability for continuous improvement activities focused on reducing the occurrence of excess and obsolete inventory by identifying and addressing the related root causes
You can use the sales cycle of each item to ascertain when it has become outdated. In the event that the sales cycle is usually within a week, and there are suddenly no sales for a month, then that is a strong sign that the item is becoming obsolete, and you have to release such an item immediately to cut loss.
You can use SCMDOJO’s Inventory Optimisation Tool with AI Co-Pilot to control inventory, improve visibility, recommendations, and AI-powered insights.

7) Excess Inventory
Excess inventory is the outcome of poor management of material flow or stock demand. Excessive Inventory is also linked with revenue loss, and it remains a threat to your business bottom line.
Excessive Inventory levels feature various cost considerations that include revenue loss from products with less demand and costs associated with storing inventory (carrying costs). These costs add up rapidly across many factors. If not managed appropriately, the best case for any business is to sell off excess stock to break even and only lose a small percentage of profit.
There are different approaches to precisely detect excess inventory with reserve recorded together with forecasted demand. The total for any excess inventory should be determined yearly and an entry logged at year-end to regulate any excess inventory grant. The Excess Inventory Allowance should equal 50% as a minimum for excess inventory.
The above Excess and Obsolete Stocks is also mentioned as Slow Moving and Obsolete Stock.
I have created an Inventory Mastery Kit that includes a full course on inventory management, an Inventory Optimisation Tool, a Stocktaking procedure and a cycle counting procedure. You can get it by clicking the button below.

8) Stockout Rate
Description: This metric monitors how often a lack of materials, components, or finished goods occurs, indicating the adequacy of inventory levels and the ability to fulfill demand promptly. A stockout refers to when needed items are unavailable.
Formula: Stockout Rate = (Number of Stockout Events / Total Number of Demand Events) × 100
Alternatively, based on customer service ratio: Stockout Percentage = (1 – Customer Service Ratio) × 100%
9) Supplier Performance
Description: This KPI evaluates vendor performance based on critical factors such as delivery timeliness, product quality, and responsiveness to incidents, reflecting the supplier’s overall reliability and effectiveness.
Formula (Simplified Score): Supplier Performance Score = (On-Time Deliveries + Defect-Free Deliveries + Responsive Incidents Resolved) / (Total Deliveries + Total Deliveries + Total Incidents) × 100
Formula (Weighted Index): Supplier Performance Index = (On-Time Deliveries / Total Deliveries × W₁) + (Defect-Free Units / Total Units Received × W₂) + (Issues Resolved / Total Issues Raised × W₃)
Where W₁, W₂, and W₃ are weighting factors assigned to each dimension (timeliness, quality, responsiveness), and W₁ + W₂ + W₃ = 1.
10) Accuracy of Inventory Records
Description: This measures the precision of inventory data by comparing recorded stock levels with actual physical counts to ensure data integrity and prevent discrepancies. Inventory accuracy signifies that the on-hand quantity matches the perpetual balance within designated tolerances.
Formula (Item Level): Inventory Record Accuracy (%) = (Number of Items with Matching Records / Total Number of Items Counted) × 100
Formula (Unit Level): Inventory Record Accuracy (%) = (1 – |Recorded Quantity – Physical Count| / Physical Count) × 100
11) Emergency Response Time
Description: This assesses the efficiency and speed of the procurement process for urgently needed items during emergencies, measuring the duration from request to receipt.
Formula (Single Event): Emergency Response Time = Date/Time of Item Receipt – Date/Time of Emergency Request
Formula (Average across Multiple Events): Average Emergency Response Time = Σ (Receipt Timeᵢ – Request Timeᵢ) / n
Where ‘n’ is the total number of emergency procurement events measured. A lower value indicates a more efficient emergency response capability.
Conculsion
Distinguishing the correct Inventory Management KPIs is essential to enhancing inventory control. You also need the information needed for perfect, precise inventory control, which is a significant part of any inventory control.
There are various KPIs you can adopt to run your business. In this article, the focus has been on the significant KPIs for effective inventory control. The list of KPIs is simply a great start on which inventory management KPIs you can choose for your inventory. Nevertheless, it is up to you to determine which ones will make your tasks more proficient while keeping your customers happy.
In all, realizing which Inventory Management KPIs to focus on and understanding what they mean is essential to successfully deal with your stock. In the event that you are not presently reporting and following your inventory KPIs on a regular basis, your competitors likely have an edge over you.
Therefore, start observing now. Remember that you need not utilise all the KPIs on the go. Depending on your needs, choose the KPIs that best fit your business tasks. If you are new to this, pick a basic KPI. It will help you see how well your stock is performing. Checking these KPIs is exceptionally useful, as it enables you to identify patterns that help you make relevant decisions and plans to improve the entire inventory management framework.
If you are using any other Inventory Management KPIs which I have not mentioned here, please do mention that in the comments sections below
FAQ: Inventory Management KPIs
What are Inventory Management KPIs?
Inventory Management KPIs are measurable metrics used to evaluate how effectively a company manages its stock levels, inventory costs, and product availability. These KPIs help businesses track performance, reduce excess inventory, prevent stockouts, improve cash flow, and optimize supply chain efficiency.
What are the most important Inventory Management KPIs?
The most important Inventory Management KPIs include:
• Days of Inventory on Hand (DOH)
• Inventory Turnover Ratio
• Inventory Aging
• Gross Inventory Value
• Net Inventory
• Excess Inventory
• Obsolete Inventory
These KPIs help supply chain professionals measure stock performance and improve inventory planning decisions.
What is Days of Inventory on Hand (DOH)?
Days of Inventory on Hand (DOH) measures how many days a company can continue selling using its current inventory without replenishment. It is calculated by dividing average inventory by cost of goods sold (COGS) per day. Lower DOH usually indicates better inventory efficiency.
What is Inventory Turnover?
Inventory Turnover measures how many times inventory is sold and replaced during a specific period, usually annually. It is calculated by dividing Cost of Goods Sold (COGS) by average inventory. Higher turnover indicates strong demand and efficient inventory management.
Why are Inventory KPIs important for businesses?
Inventory KPIs are important because they help businesses reduce inventory carrying costs, improve cash flow, avoid stockouts, increase warehouse efficiency, and improve customer service levels. By monitoring these KPIs regularly, companies can make better supply chain and purchasing decisions.
What is the difference between Gross Inventory and Net Inventory?
Gross Inventory represents the total value of all inventory items owned by a company. Net Inventory excludes damaged, obsolete, reserved, or allocated stock. Net inventory reflects the actual inventory available for sale to customers.
What is Inventory Aging?
Inventory Aging measures how long products remain in stock before being sold. It helps identify slow-moving or outdated inventory. Older inventory increases carrying costs and may require markdowns, discounts, or liquidation strategies.
What is Obsolete Inventory?
Obsolete Inventory refers to stock that can no longer be sold because it is outdated, damaged, or no longer in demand. Tracking obsolete inventory helps businesses reduce financial losses and implement better inventory planning strategies.
How do Inventory KPIs improve supply chain performance?
Inventory KPIs improve supply chain performance by providing data-driven insights into stock levels, demand patterns, warehouse efficiency, and supplier performance. This enables companies to optimize inventory planning, reduce operational costs, and improve customer delivery performance.
How often should inventory KPIs be monitored?
Inventory KPIs should ideally be monitored monthly or quarterly depending on the business type. Fast-moving industries such as retail or e-commerce may monitor inventory metrics weekly to quickly respond to demand changes.
About the Author- Dr. Muddassir Ahmed
Dr. Muddassir Ahmed is a globally recognized supply chain expert, thought leader, and keynote speaker. As the Founder & CEO of SCMDOJO, he has built one of the world’s leading platforms dedicated to empowering supply chain professionals with cutting-edge knowledge, practical tools, and access to expert insights. With over 19 years of leadership experience spanning the UK, Europe, the Middle East, and Southeast Asia, Dr. Ahmed has held key roles at Bridgestone, Doncasters Group, Eaton, and Volvo Cars, managing multi-million-dollar supply chain operations.
His expertise spans all facets of supply chain management, with a particular focus on leveraging technology and innovation to optimize processes and build resilient supply chains.
Recognised among the Top 10 Supply Chain Influencers in the World by Supply Chain Digital, Dr. Ahmed has been instrumental in shaping industry best practices through his extensive research, vlogs, and thought leadership. Holding a PhD in Management Science from Lancaster University Management School, he is also a certified Six Sigma Black Belt.
His platform, SCMDOJO, serves a vibrant community with over 51,000 monthly visitors. Moreover, he has 72,000 newsletter subscribers, and a social media following exceeding 105,000 supply chain professionals
A sought-after keynote speaker and thought leader, sharing his insights on industry trends, best practices, and the future of supply chain management. Dr. Ahmed delivers high-impact talks on supply chain excellence, digital transformation, and strategic leadership. His mission is clear: to help supply chains thrive
You can follow him on LinkedIn, Facebook, Twitter, TikTok or Instagram
CIPS Knowledge Paper by Susan Randall – https://www.cips.org/Documents/Knowledge/Procurement-Topics-and-Skills/Members%20only%20content/Stocktaking%20and%20inventory%20measurement%20as%20a%20means%20to%20improve%20profitability%20-%20Susan%20Randall.pdf


luis vuitton outlet
luis vuitton outlet
louis vuitton outletbags