Want to optimize your supply chain metrics and drive significant improvements? Understanding and tracking key supply chain metrics is essential.
This guide will equip you with the knowledge you need to make data-driven decisions, achieve your business goals, and boost your supply chain metrics.
✅ For beginners, the basics of supply chain is the best place to begin before advancing to specialized courses.
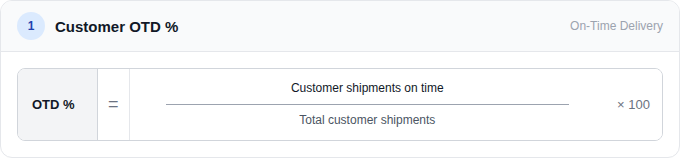
1. Customer OTD (On-Time Delivery) %
Definition
One of the most critical KPIs in supply chain metrics is the percentage of order lines delivered to the customer within the agreed-upon timeframe. This metric reflects how well the company meets customer delivery expectations.
Calculation
Issues to Consider
- It is mandatory to report this KPI for the Electrical Sector.
- This supply chain metrics KPI measures the delivery performance to the request of the customer or the committed and/or confirmed date to the customer in dependence on the respective business demand.
On-time delivery Performance is one of the key metrics in the Supply Chain. It represents the customer service levels of an organization. To learn more about it, you can look at “13 Possible Nightmares That Stops You to Provide Great On-Time Delivery Performance.”
Read More About On-Time Delivery
EPM (Enterprise Performance Management) – relevant fields
- Customer On-Time Delivery % (Calculated)
– Customer Shipments # (Manual Input)
– Customer Shipments On Time # (Manual Input)
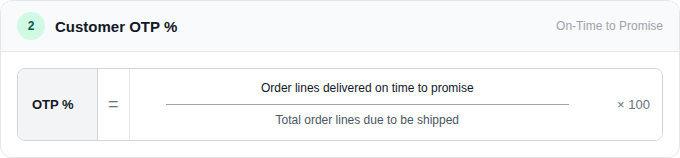
2. Customer OTP (On-time performance) %
Definition
The percentage of order lines delivered to the customer within the promised delivery date measures the company’s ability to fulfill its delivery commitments.
Calculation
Issues to Consider
- All materials management organizations must report to this supply chain metrics KPI.
- However, all order lines processed in the defined period have to be measured with the exception that order lines delayed due to reasons caused by the customer should be excluded.
- This supply chain metrics KPI measures the delivery performance to the first delivery date committed and/or confirmed to the customer.
- Performance is measured as a percentage of all order lines dispatched on time and in full compared to the total number of order lines to be dispatched.
- If an order line is dispatched with partial shipments, the measure point is the date of the last partial delivery on an order line.
- The metric OTP includes intercompany orders. Reporting OTP for external and internal customers as separate metrics is mandatory.
We have created a Logistics KPIs Dashboard showcasing 25 of the most frequently used Logistics KPIs in the Manufacturing & Distribution Industry. It can help you so much with “Time Indicators” & will improve your On-Time Performance. You can download the file when purchased as an individual product or as an SCMDOJO member (providing better value for the user).
EPM (Enterprise Performance Management) – relevant fields
- Customer OTP % – Total (Calculated)
- Customer OTP % – External (Calculated)
– Customer Order Lines delivered On Time to Promise (external) # (Manual Input)
– Customer Order Lines Due to be Shipped external # (Manual Input) - Customer OTP % – Internal (Calculated)
– Customer Order Lines delivered On Time to Promise (internal) # (Manual Input)
– Customer Order Lines Due to be Shipped Internal # (Manual Input)
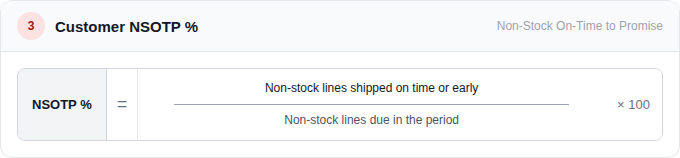
3. Customer NSOTP (Non-Stock Order Lines Delivered To Promise) %
Definition
Percentage of non-stock order lines delivered within the promised delivery date.
However, it focuses on the performance of providing items that are not typically stocked.
Calculation
Issues to Consider
- All materials management organizations must report this KPI.
- All order lines for non-stock articles processed in the defined period have to be measured with the exception that order lines delayed due to reasons caused by the customer should be excluded.
- This KPI measures the delivery performance to the first delivery date committed and/or confirmed to the customer.
- Performance is measured as a percentage of all order lines dispatched on time and in full compared to the total number of order lines to be dispatched.
- Moreover, the delivery date must be adjusted prior to the first communication with the customer.
- If an order line is dispatched with partial shipment, the measure point is the date of the last partial delivery on an order line.
- The metric NSOTP includes intercompany orders as well, and it is mandatory to report OTP for external customers and internal customers.
Improve your NSOTP Metrics by buying our Logistics KPI Dashboard!
EPM (Enterprise Performance Management) – relevant fields
- Customer OTD % (NSOTP “Non-Stock Lines Shipped On-Time Period“) (Calculated)
– Non-Stock Lines Shipped On-Time or Early # (Manual Input)
– Non-Stock Lines Due in the Period or Shipped in the Period # (Manual Input)
Become a Supply Chain Master with the Supply Chain Track
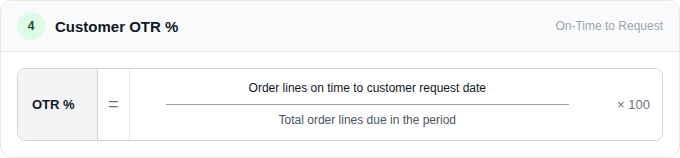
4. Customer OTR (Over The Road) %
Definition
Percentage of order lines delivered within the customer’s requested ship date.
Moreover, it measures performance based on specific customer delivery needs.
Calculation
Issues to Consider
- All materials management organizations must report this KPI.
- This supply chain metric measures on-time performance to our customer’s requested ship date at the sales order line level.
- Additionally, measurement is when the order line is due to be shipped. However, it shows the total number of lines expected to be shipped during a given period versus the number of lines that were shipped on time and in full.
- Moreover, all order lines with a customer-requested ship date in the defined period have to be measured.
- The request date should be corrected according to the agreed delivery plan, picking, and packing times, as well as other agreements with the customer, such as decided order deadlines.
- OTR (Over The Road) is a supply chain metric that includes orders. It is mandatory to report OTR for external and internal customers. However, it is also necessary to report OTR for exterior external customers and OTR for internal customers as separate supply chain metrics.
EPM (Enterprise Performance Management) – relevant fields
- Customer OTR % – Total (Calculated)
- Customer OTR % – External (Calculated)
– Customer Order Lines delivered On Time to Request (external) # (Manual Input)
– Customer Order Lines Due to be Shipped external # (Manual Input) - Customer OTR % – Internal (Calculated)
– Customer Order Lines delivered On Time to Request (internal) # (Manual Input)
– Customer Order Lines Due to be Shipped Internal # (Manual Input)
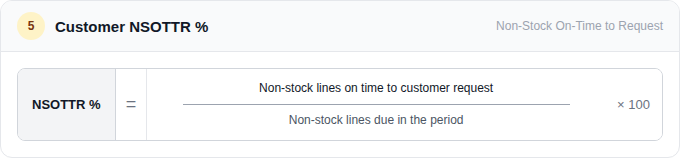
5. Customer NSOTTR (Non-Stock Order lines delivered on Time To Request) %
Definition
Percentage of non-stock order lines delivered within the customer’s requested ship date. Moreover, it focuses on the performance of delivering non-stocked items based on customer requests.
Calculation
Issues to Consider
- All materials management organizations must report this KPI. However, if it is not currently available, recording customer-requested delivery dates must be considered for future adjustments to the existing IT system.
- This metric measures on-time performance to our customer’s requested ship date at the sales order line level.
- Moreover, measurement is when the order line is due to be shipped. However, it shows the total number of lines expected to be shipped during a given period versus the number of lines that were shipped on time and in full.
- All order lines with a customer-requested ship date in the defined period have to be measured, with the exception that order lines delayed due to reasons caused by the customer should be excluded.
- The metric NSOTTR (Non-Stock Order lines delivered on Time To Request) includes intercompany orders, and it is mandatory to report NSOTTR for external customers and internal customers, as well as to report NSOTTR external customers and NSOTTR internal customers as separate metrics.
✅ Advance your career with expert-led SCM courses online
And if you want to learn in-depth about supply chain KPIs, you should check out our course “Essential Supply Chain KPIs: Measure, Analyze, Improve” by Paul Denneman. The course, which covers financial measures, operational metrics, and reporting techniques, provides you with a holistic understanding of supply chain management.

EPM (Enterprise Performance Management) – relevant fields for NSOTTR
- Customer NONSTOCK OTTR % – Total (Calculated)
- Customer NONSTOCK OTTR % – External (Calculated)
– Customer NONSTOCK Order Lines Shipped On Time to Request (Internal) # (Manual Input)
– Customer NONSTOCK Order Lines Due to be Shipped Internal # (Manual Input) - Customer NONSTOCK OTTR % – Internal (Calculated)
– Customer NONSTOCK Order Lines Shipped On Time to Request (External) # (Manual Input)
– Customer NONSTOCK Order Lines Due to be Shipped external # (Manual Input)
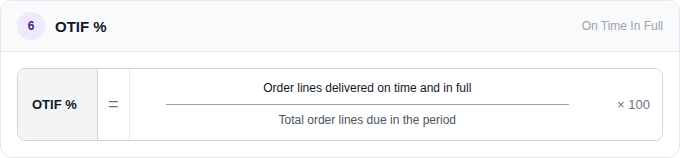
6. OTIF (On Time In Full)
Definition
The percentage of order lines delivered on time and in full to selected external customers measures the overall delivery performance, considering both timeliness and completeness.
Calculation
Issues to Consider
- It is mandatory to report this KPI to external customers for selected businesses.
- All order lines processed in the defined period have to be measured with the exception that order lines delayed due to reasons caused by the customer should be excluded.
- This KPI measures the delivery performance to the first delivery date committed and/or confirmed to the customer.
- Performance is measured as a percentage of all order lines dispatched on time and in full compared to the total number of order lines to be dispatched.
- The first commit date can be defined as the delivery date based on the local agreements with the customer.
- If an order line is dispatched with partial shipments, the measure point is the date of the last partial delivery on an order line.
- All deliveries have to be included.
Are you responsible for measuring key performance indicators for the supply chain in your organization?
You can enhance your business performance with our exclusive Supply Chain KPI Dashboard. This powerful Excel tool is designed for easy customization, making it a valuable resource for monitoring, measuring, and controlling key performance indicators.

EPM (Enterprise Performance Management) – relevant fields
- Customer OTIF % – external (Calculated)
– Customer Orders delivered On Time (OTIF – external – select businesses) # (Manual Input)
– Customer Orders Due to be Shipped OTIF in Period # (Manual Input)
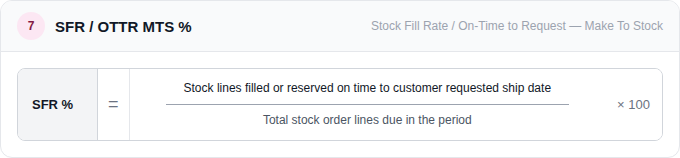
7. SFR (Stock Fill Rate) / OTTR MTS (On-Time To Request – Make To Stock)
Definition
The percentage of order lines for stock items that can be fulfilled on or before the customer’s requested ship date measures the ability to meet the demand for readily available products.
Calculation
Issues to Consider
- This KPI is mandatory for all materials management operations with stocked material to be sold to customers.
- The measurement is only applied to stock articles based on order lines.
Stock articles are defined as articles to be stocked regardless of whether they are - in stock at the time of the measurement or if there are stockouts.
- Order lines for stock articles that could be delivered entirely on or before the customer’s requested date are measured as OK.
- The delivery date requested by the customer should be corrected by the lead time to the customer in order to avoid unrealistic request dates.
- Suppose deliveries of order lines are blocked because they undercut the safety stock level.
- The KPI measures the possibility of delivering according to the customer’s request date only.
EPM (Enterprise Performance Management) – relevant fields
- Customer OTD % – SFR (Calculated)
– Stock Lines Filled or Reserved On-Time # (Manual Input)
– Stock Order Lines Due In the Period # (Manual Input)
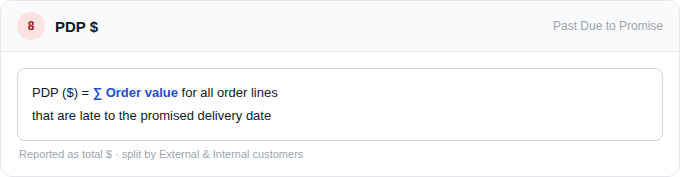
8. PDP (Past Due To Promise)
Definition
The total dollar value of order lines that are late to the promised delivery date.
Measures the financial impact of late deliveries.
Calculation
The sum of the order value for all order lines that are late to the promised date.
Issues to Consider
- All materials management organizations must report this KPI.
- Total lines shipped include external customers, third parties, and inter/intra Cooper.
- Moreover, past dues are based on the Original PGI (Post-Goods Issue) and the Original Request PGI (Post-Goods Issue) dates.
- Keep an eye on Date changes, credit & delivery blocks, and lead time issues.
- The PDP (Past Due to Promise) metric includes intercompany orders. Additionally, reporting PDP for external and internal customers is mandatory. However, reporting PDP External and PDP Internal as separate metrics is also necessary.
EPM (Enterprise Performance Management) – relevant fields
- Customer Order Lines – PDP $ – Total (Calculated)
– Customer Order Lines – PDP $ – Internal (Manual Input)
– Customer Order Lines – PDP $ – External (Manual Input)
Download Free Supply Chain KPIs Cheat Sheet PDF
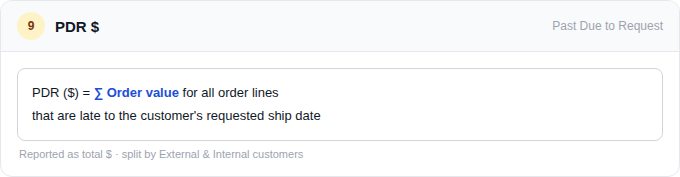
9. PDR (Past Due to Request)
Definition
The total dollar value of order lines that are late to the customer’s requested ship date. Measures the financial impact of not meeting customer delivery requests.
Calculation
The sum of the order value for all order lines that are late to the customer’s requested ship date.
Issues to Consider
- All materials management organizations must report this KPI.
- Total lines shipped include external customers, third parties, and inter/intra Cooper.
- Date changes, credit & delivery blocks, lead time issues.
- The metric PDR (Past Due to Request) includes intercompany orders. I
- It is mandatory to report PDR for external and internal customers and to report PDR External and PDR Internal as separate metrics.
EPM (Enterprise Performance Management) – relevant fields
- Customer Order Lines – PDR $ – Total (Calculated)
– Customer Order Lines – PDR $ – Internal (Manual Input)
– Customer Order Lines – PDR $ – External (Manual Input)
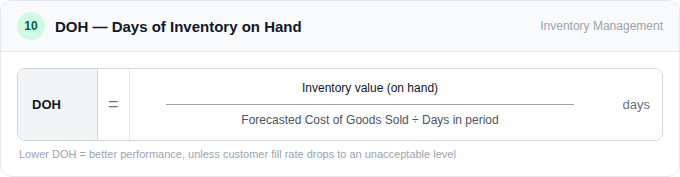
10. DOH (Days of Inventory on Hand)
Definition
Inventory days on hand refer to the average number of days that inventory can be used to fulfill customer demand before requiring replenishment.
Inventory management organizes stock control from manufacturing to distribution/warehouses and onward to sales locations. DOH is one of the central aspects of inventory management. Want your inventory to be spot on? Buy our “Material Management Competencies Assessment.”

Calculation
Calculated based on the ratio of inventory value to the forecasted cost of goods sold. Refer to the provided calculation example for a detailed breakdown.
Issues to Consider
- This KPI is mandatory for all materials management operations.
- The KPI “Days of Inventory on Hand (DOH)” indicates the average number of days that customers can continue to be supplied before the available inventory is exhausted.
- However, it measures the Time required to convert inventory into sales. Moreover, the lower the DOH (Days of Inventory on Hand), the better, unless the ability to fill customer orders drops to an unacceptable level.
- Additionally, DOH is a KPI that, in terms of ledger basics, is reported in Encore as “Month Specific DOH” on the AN201A Encore report (annual) and “YTD (Year-to-Date)” on the PM301CY Encore report.
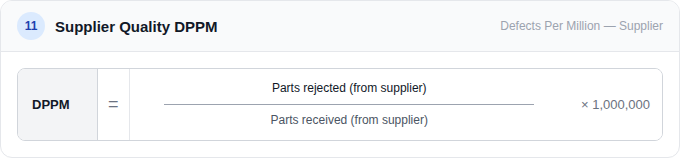
11. Supplier Quality DPPM (Defects Per Million)
Definition
This metric measures the number of defective parts per million received from a supplier. It’s a key indicator of supplier quality performance. This KPI boosts supply chain metrics.
Calculation
Issues To Consider:
- For reliable DPPM (Defects Per Million) calculations, it is crucial to ensure consistent application of defect definitions, accurate and timely data recording, and the utilization of a standardized system for data collection and entry.
- Inaccurate root cause analysis can hinder the effective implementation of corrective action.
- Effective communication between receiving departments and suppliers is paramount.
- However, adequate resources for quality inspection and testing, along with proper training for quality inspectors, are critical for accurate DPPM calculations and effective quality management.
- The absence of a documented procedure for handling non-conforming material and a robust system for tracking and reporting supplier performance data can significantly impact the effectiveness of the DPPM metric.
Check out our procurement KPI dashboard if you want to measure the number of defective parts per million received from a supplier with just a click!

EPM (Enterprise Performance Management) – relevant fields
- Supplier Quality – Total (DPPM) # (Calculated)
- Supplier Quality – External (DPPM) # (Calculated)
– Received (External suppliers) # (Manual Input)
– Rejected (External suppliers) # (Manual Input)
- Supplier Quality – Internal (DPPM) #(Calculated)
– Received (Internal suppliers) # (Manual Input)
– Rejected (Internal suppliers) # (Manual Input)

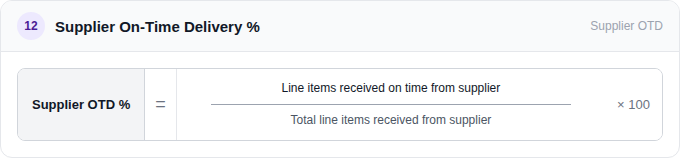
12. Supplier On-Time Delivery %
Definition
This key performance indicator (KPI) measures the percentage of orders received from suppliers that arrive on or before the agreed-upon delivery date. Moreover, it is one of the central parts of supply chain metrics.
Calculation
Issues to Consider
- Clearly define what constitutes an “on-time” delivery. Consider factors like acceptable delivery windows, partial shipments, and agreed-upon delivery dates.
- Ensure accurate and timely recording of delivery dates, both promised and actual.
Clear and consistent communication with suppliers regarding delivery expectations and potential delays is crucial. - Investigate the root causes of late deliveries, such as production delays, transportation issues, or unforeseen circumstances.
- Regularly monitor and analyze supplier OTD (On-Time Delivery) performance to identify trends and areas for improvement.
- Implement corrective and preventive actions to address root causes of late deliveries and improve overall supplier performance.
Don’t miss out on the opportunity to transform your supplier management strategies. “Supplier Excellence Manual” is more than just a resource—it’s an investment in the future of your business. Elevate your supply chain to new heights of efficiency and collaboration and confidently navigate modern procurement’s complexities.

EPM (Enterprise Performance Management) – relevant fields
- Supplier On Time Delivery % (Calculated)
- Supplier On Time Delivery – Internal % (Calculated)
– Line Items – Received On-Time (Internal Suppliers) # (Manual Input)
– Line Items – Received (InternalSuppliers) # (Manual Input)
- Supplier On Time Delivery – External % (Calculated)
– Line Items – Received On-Time (External Suppliers) # (Manual Input)
– Line Items – Received (External Suppliers) # (Manual Input)
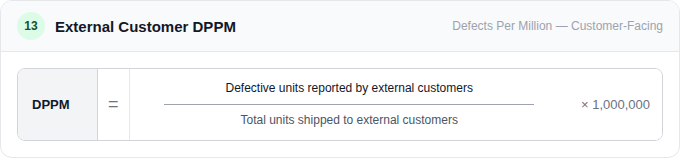
13. External Customer DPPM (Defects Per Million)
Definition
Measures the number of defects per million units shipped to external customers.
Moreover, DPPM (Defects Per Million) is a critical indicator of overall product quality and customer satisfaction. A high DPPM indicates significant quality issues and the potential for customer dissatisfaction, returns, and lost revenue.
Calculation
Issues to Consider
- Clearly define what constitutes a defect from the customer’s perspective.
- Additionally, establish a robust system for collecting and analyzing customer feedback.
- Utilize CRM systems (Customer Relationship Management) to track customer interactions and identify trends.
- Conduct thorough root-cause analyses of customer complaints to identify underlying issues in the design, manufacturing, or delivery process.
- Proactively address customer concerns and complaints.
- Communicate corrective actions taken to address identified issues.
- Implement corrective and preventive actions to reduce defects and improve customer satisfaction.
- Regularly review and refine quality control processes based on customer feedback and internal data analysis.
Download Free Procurement KPIs Cheat Sheet PDF
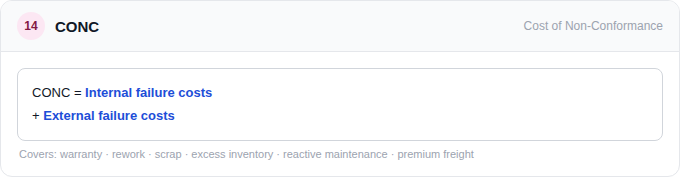
14. CONC (Cost of Non-Conformance)
Description
The CONC supply chain metric monitors six key elements that provide valuable feedback on some of the prime drivers of waste in our operations. Moreover, the six elements of CONC are as follows.
- Product Warranty
- Rework
- Scrap
- Excess & Obsolete Inventory
- Reactive Maintenance
- Premium Freight
Calculation
CONC (Cost of Non-Conformance) can be challenging to quantify accurately. It involves identifying and measuring various costs associated with quality failures, including the sum of internal failure costs and external failure costs.
Issues to Consider
- Accurately identifying and quantifying all costs associated with quality failures can be complex.
- Moreover, costs can be direct or indirect.
- Reliable data collection and analysis are crucial for accurate CONC (Cost of Non-Conformance) calculations.
- This may require implementing robust tracking systems and utilizing data analysis tools.
- Identifying the root causes of quality failures is essential for practical cost-reduction efforts.
- A thorough root cause analysis can help pinpoint areas for improvement and prevent future occurrences.
- Allocating sufficient resources for quality improvement activities, such as training, process improvement initiatives, and data analysis.
Learn how to categorize your suppliers for targeted strategies, conduct effective evaluations to ensure quality and performance, and foster collaborative partnerships that drive mutual success with our course!

About the Author – Fatima Salman
Fatima Salman is a dynamic content writer and social media influencer with a knack for crafting compelling narratives that engage and inspire. She currently contributes her expertise at SCMDOJO and has over five years of experience as a content writer and two years in media. Her passion for storytelling and strategic content creation has made her a key player in digital marketing.
Fatima earned her bachelor’s degree in Economics and Finance from the NED University of Engineering and Technology, where she cultivated a strong analytical foundation that complements her creative skills. Her versatile background allows her to seamlessly blend data-driven insights with captivating content to drive impactful results.
Beyond her professional endeavors, Fatima is a recognized social media influencer. She shares her unique perspectives and lifestyle inspirations with a growing online community.